last modified: 2023-04-10
Gephi workshops
I organize online workshops and personalized trainings for Gephi, for beginners and experts. To schedule one or to get more information: analysis@exploreyourdata.com.
Goals of this tutorial
-
We take a normal network, where nodes have attributes which can serve as time indication (a date, a number…)
-
We convert this network into a dynamic network: nodes will appear and disappear according to their attributes.
download a network file for practice
download this zip file and unzip it on your computer.
or use this direct link: https://tinyurl.com/gephi-tuto-4
You should find the file miserables-with-dates.gexf in the zip file. Save it in a folder you will remember (or create a folder specially for this small project).
This file contains a network representing "who appears next to whom" in the 19th century novel Les Misérables by Victor Hugo[1].
A link between characters A and B means they appeared on the same page or paragraph in the novel.
The file name ends with ".gexf", which just means this is a text file where the network information is stored (name of the characters, their relations, etc.), following some conventions.
This file has been modified to add some dates to each character in the novel:
-
a "start date", which is a day (example: 22/09/1835). This is the date when the character enters the action in the novel
-
an "end date", also a day (example: 22/09/1840). This is the date when the character leaves the action in the novel
-
a "peak moment". This is a number (example: 14263). This is an instant when the character is at the center of the plot. This number has no historical meaning, this is just a chronological moment in time.
- NOTE
-
Values for start date, end date and peak moment have no real significance in the novel. They are made up for this exercise.
open the network in Gephi
-
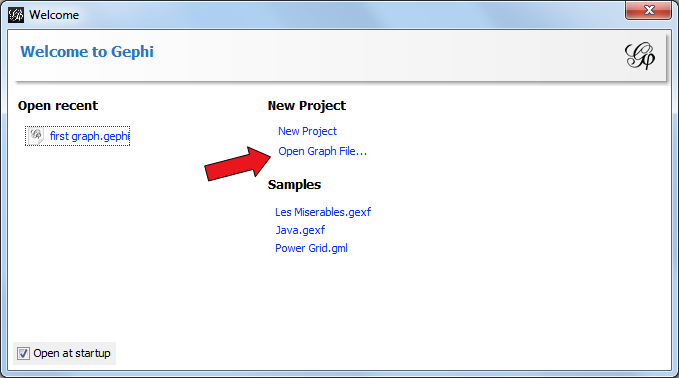
open Gephi. On the Welcome screen that appears, click on
Open Graph File -
find
miserables-with-dates.gexfon your computer and open it
A report window will open, giving you basic info on the network you opened:
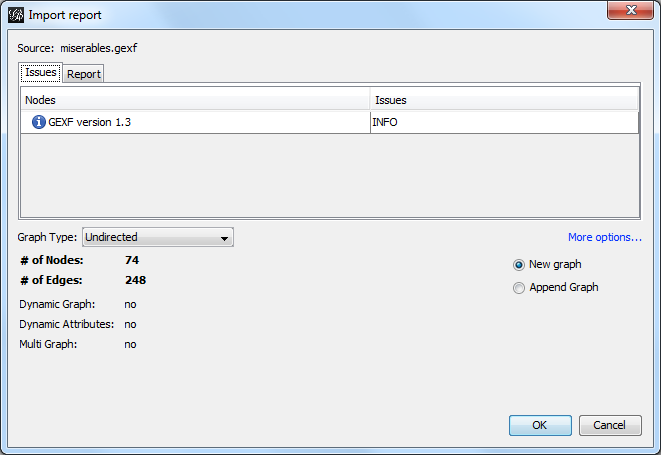
This tells you that the network comprises 74 characters, connected by 248 links.
Links are undirected, meaning that if A is connected to B, then it is the same as B connected to A.
The report also tells us the graph is not dynamic: it means there is no evolution or chronology, it won’t "move in time".
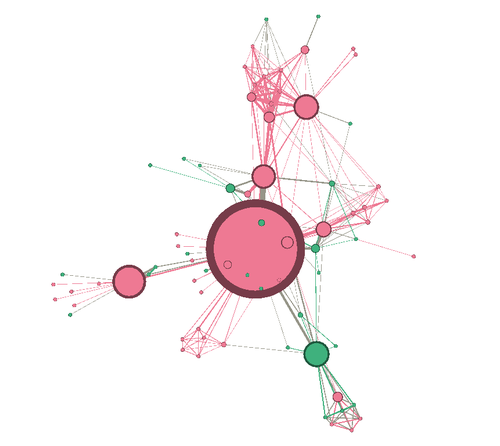
Click on OK to see the graph in Gephi.
getting a sense of the attributes in the data laboratory
We can switch to the data laboratory to see the underlying data:
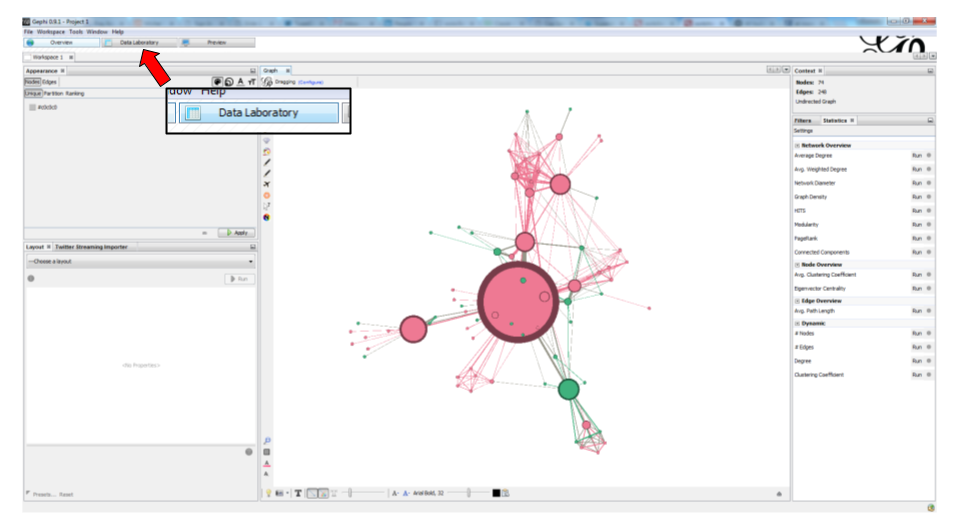
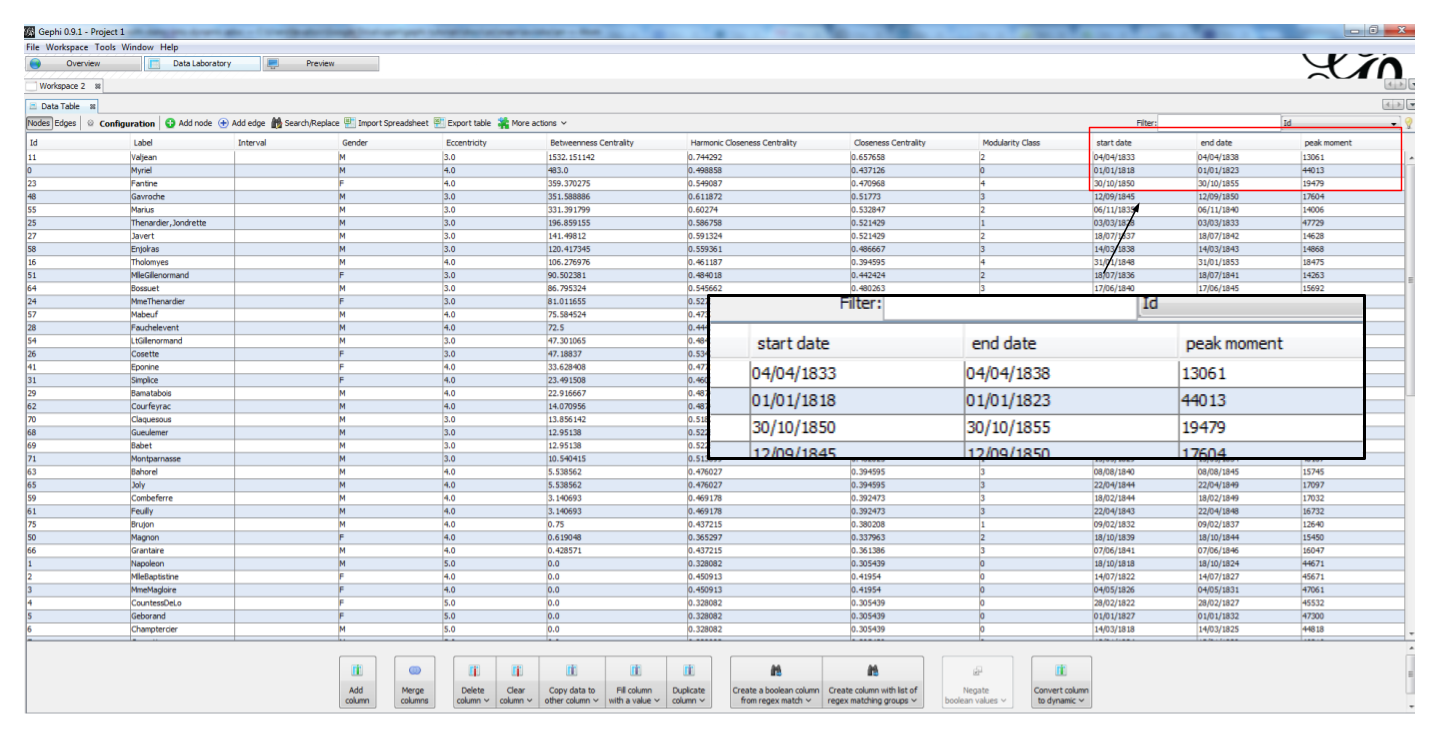
The nodes (characters) of the network have attributes (start date, end date, peak moment) which can make this graph dynamic - but it is not yet.
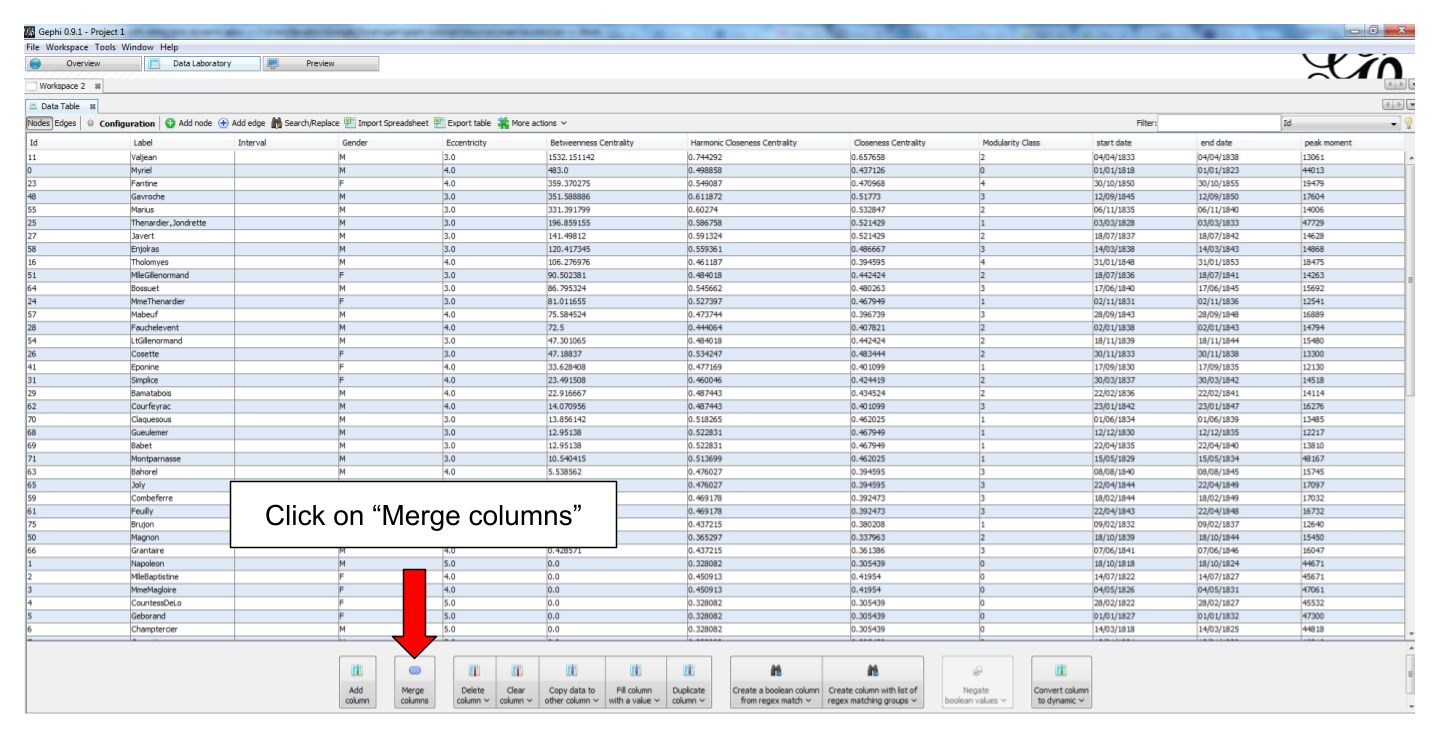
A couple of steps are needed to enable the dynamic features, and here a choice must be made:
Do we prefer to have…
-
… nodes appearing on screen at their start date, and staying on screen for ever after?
-
… nodes appearing on screen at their start date, and leaving the screen at their end date?
-
… nodes being representedsimply by their "peak moment" (a number), without reference to chronological dates?
We will present these 3 possibilities.
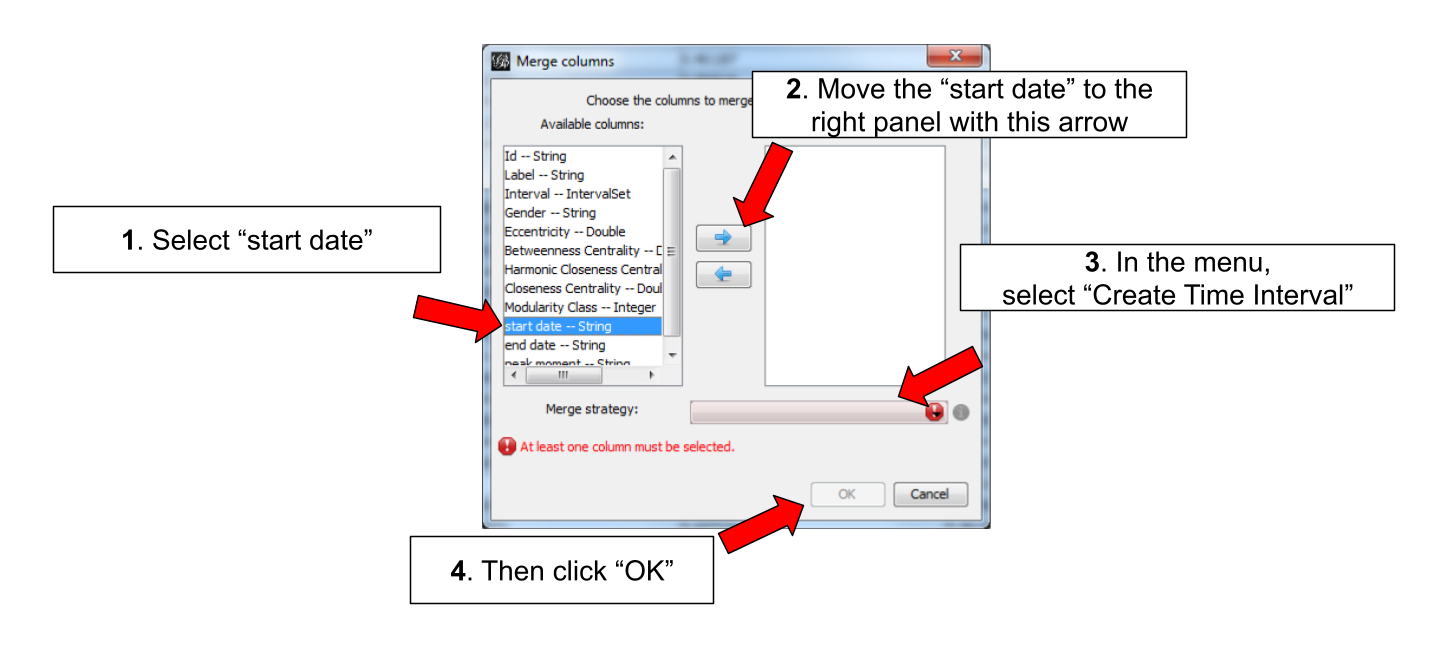
1. dynamic nodes with a start date
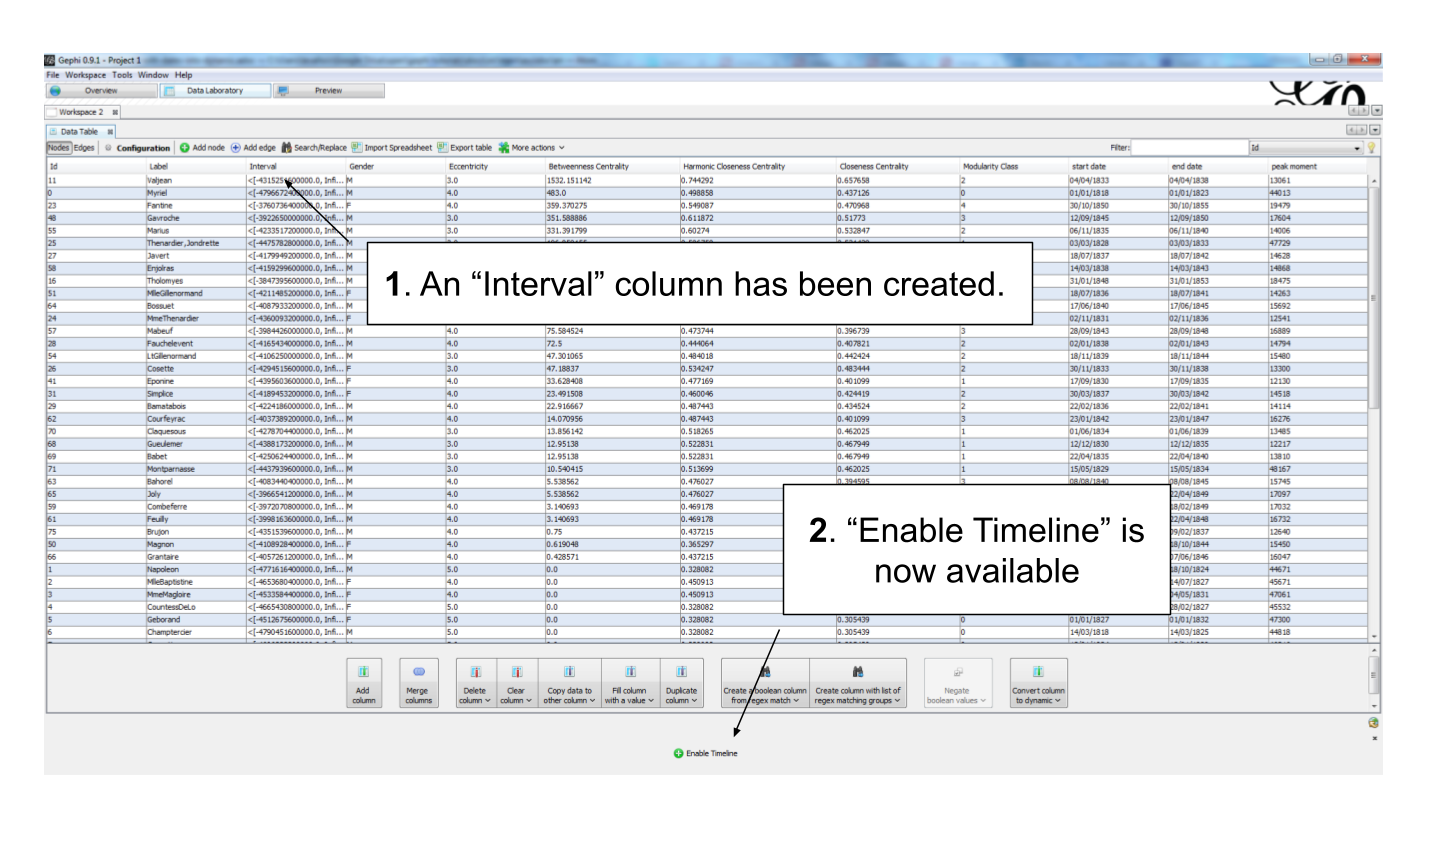
Let’s switch back to the Overview to see the graph and how it evolves in time.
- IMPORTANT
-
We are going to use the timeline to play the animation. The timeline has many features which are explained in a specific tutorial.
to be continued
more tutorials on dynamic networks with Gephi
to go further
Visit the Gephi group on Facebook to get help,
or visit the website for more tutorials
Give a try to nocodefunctions.com, the web application I develop to create networks for Gephi. Click-and-point, free, no registration needed.