Creating a network from a table of cooccurring items

2017-02-27

last modified: 2023-04-10

== !

gephi logo 2010 transparent


Gephi workshops

I organize online workshops and personalized trainings for Gephi, for beginners and experts. To schedule one or to get more information: analysis@exploreyourdata.com.

This plugin is created by Clement Levallois.

Update

This plugin has been replaced by a new and better function available on the web, developed by the same author. It is free, click and point, without registration at this address: https://nocodefunctions.com

Presentation of the plugin

This plugin is created by Clement Levallois.

It converts a spreadsheet or a csv file into a network.

This plugin enables you to:

  • Start from a data table in Excel or csv format

  • In the data table, each row describes an "occurrence" (of an event, a purchase, a relation, etc.)

  • In columns A, B, C, D, we have the entities involved: column A for persons, column B for what they bought, etc.

  • Connections will be created between entities, when they appear in the same occurrence (so, when they are on thee same row)

  • Occurrences can have dates, multiple instances of an entity can be listed in a given column.

1. The input

excel 1 en
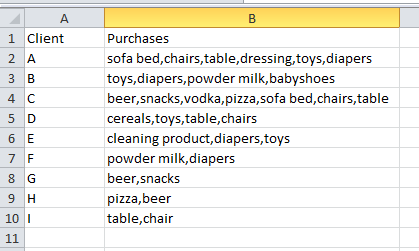
Figure 1. An Excel file


2. The output

gephi result 1 en
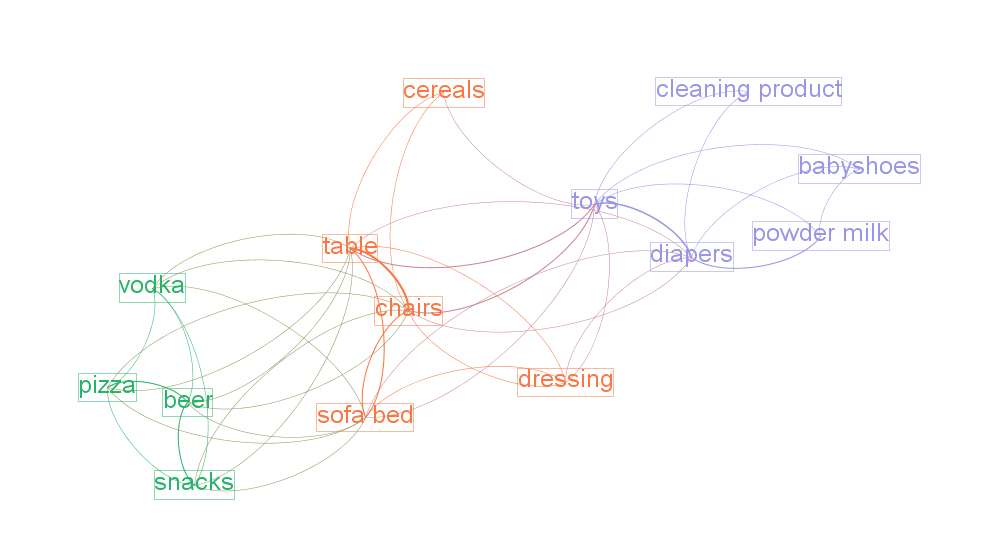
Figure 2. Resulting network


Installing the plugin

Choose the menu Tools then Plugins
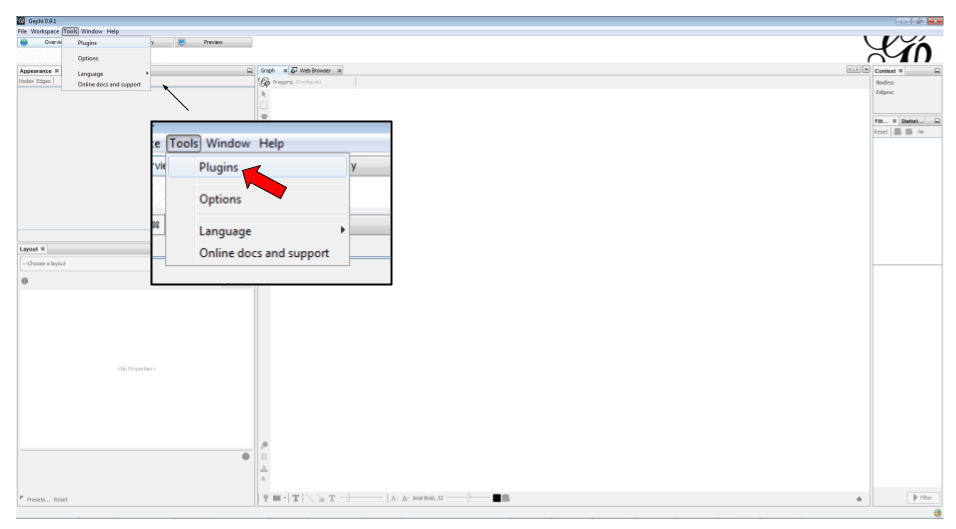
Figure 3. Choose the menu Tools then Plugins


Click on the tab Available Plugins
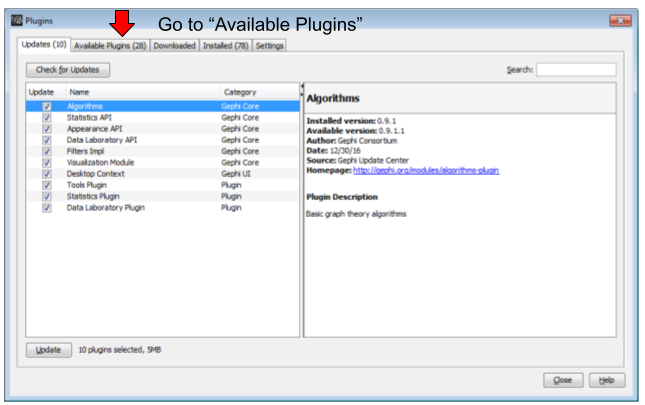
Figure 4. Click on the tab Available Plugins


Install the plugin Convert Excel and Csv files and restart Gephi
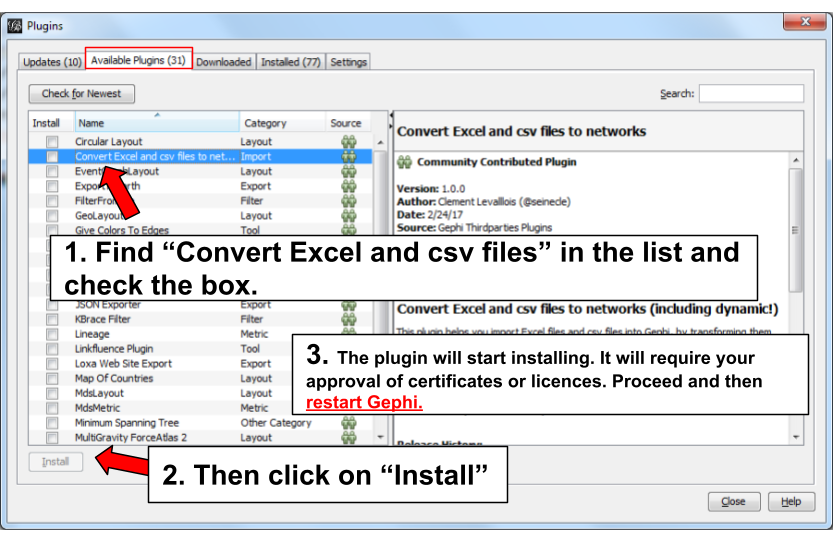
Figure 5. Install the plugin Convert Excel and Csv files and restart Gephi


Opening the plugin

Open the plugin via the menu File   Import
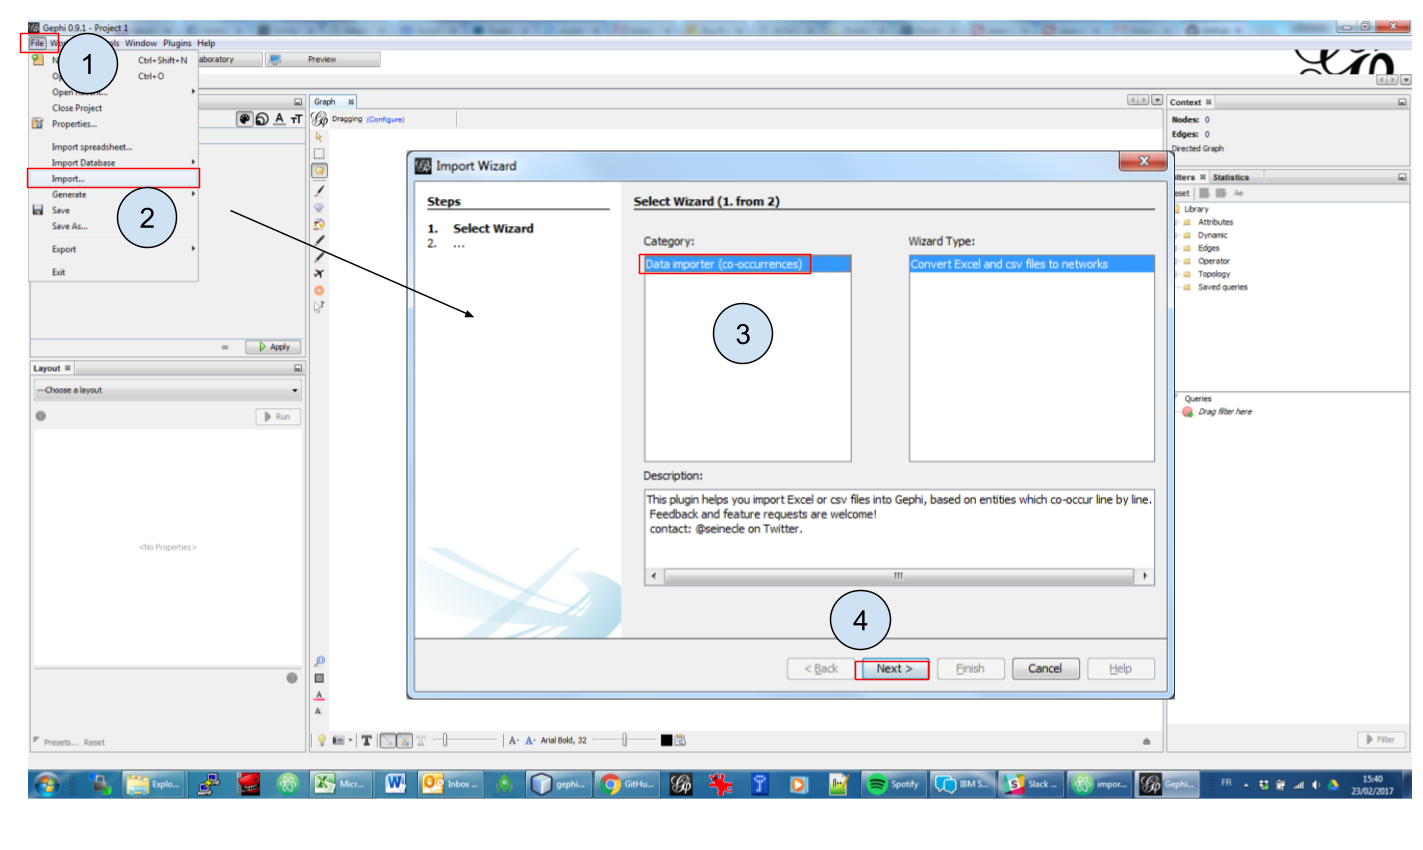
Figure 6. Open the plugin via the menu File - Import


Using the plugin

2nd panel

Select a file
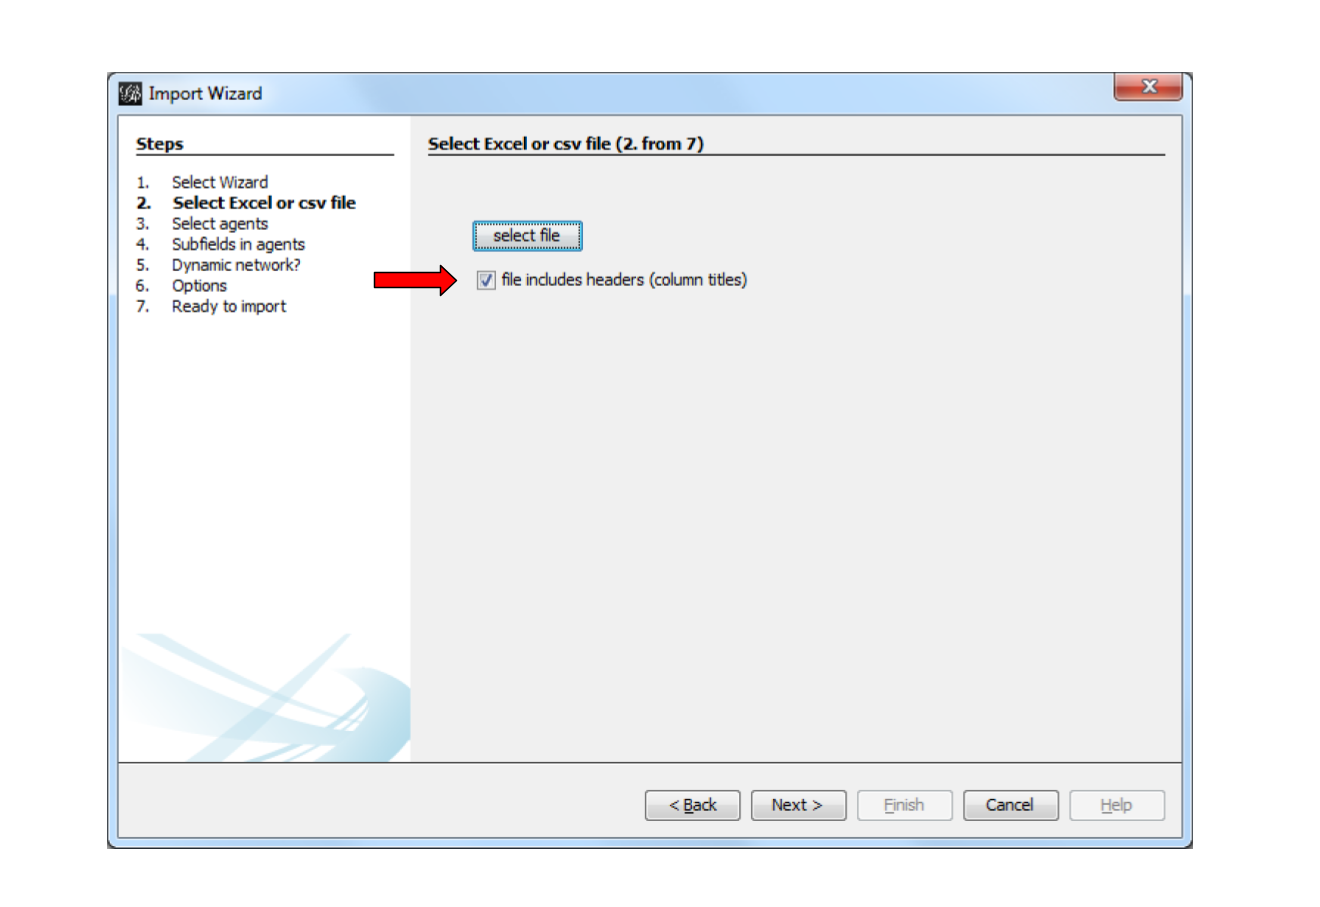
Figure 7. Select a file


excel 2 en
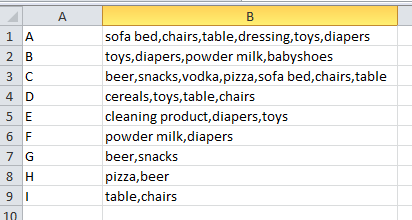
Figure 8. A file without headers


excel 1 en
Figure 9. A file with headers


To describe the next screens of the plugin, we will take the example of the Excel file just shown, with headers.

3rd panel

plugin panels 1 en
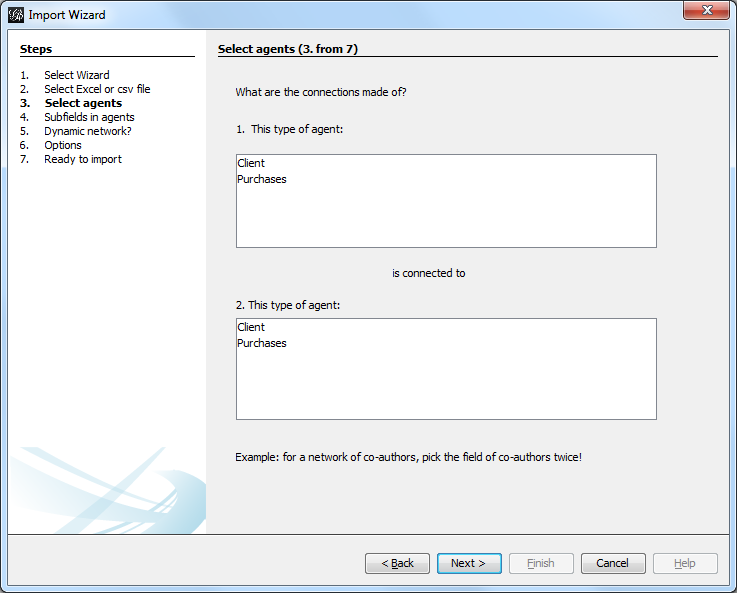
Figure 10. Which entities should be the nodes?


What does this panel mean?

If you look back at the Excel file, you see that we have "Clients" and their "Purchases".

→ This means we can build 2 different types of networks, depending on our needs:

  1. A network showing clients and products, with relations representing purchases from a client to a product.

graph g {
    rankdir="LR";
    client -- product [ label="purchased" ]
}

To create this kind of networks, choose "Client" in the upper window, and "Purchases" in the lower window of the plugin screen.

  1. Or a network where 2 products are connected, if one client puchased them together.

graph g {
    rankdir="LR";
    a -- b [label=" purchased together"]
     a [label="product 1"];
     b [label="product 2"];
}

To create this kind of networks, choose "Purchases" in the upper and lower windows of the plugin screen.

4th panel

subfield delimiter en
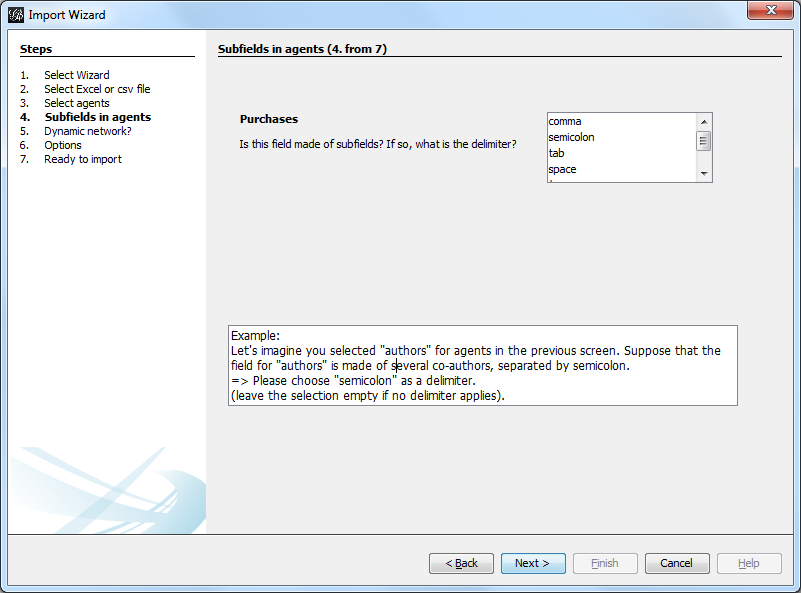
Figure 11. Choosing which delimiter is used


This 3rd panel asks: in our Excel file, how are different items separated in a given cell? In our example, we have used commas: the lists of products purchased are comma-separated:

commas shown in red
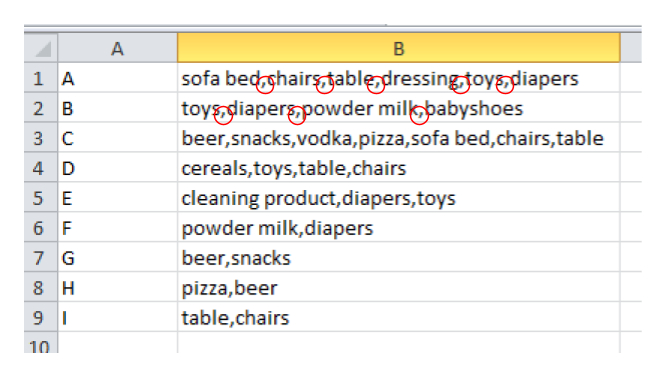
Figure 12. commas shown in red


5th panel

This panel allows you to specify whether the relations are dynamic in time, or not.

In this case, you need an extra column (column C), where a date is shown. We don’t cover this case here.

(read the tutorials on dynamic networks for a starter)

6th panel

panel 6 1 en
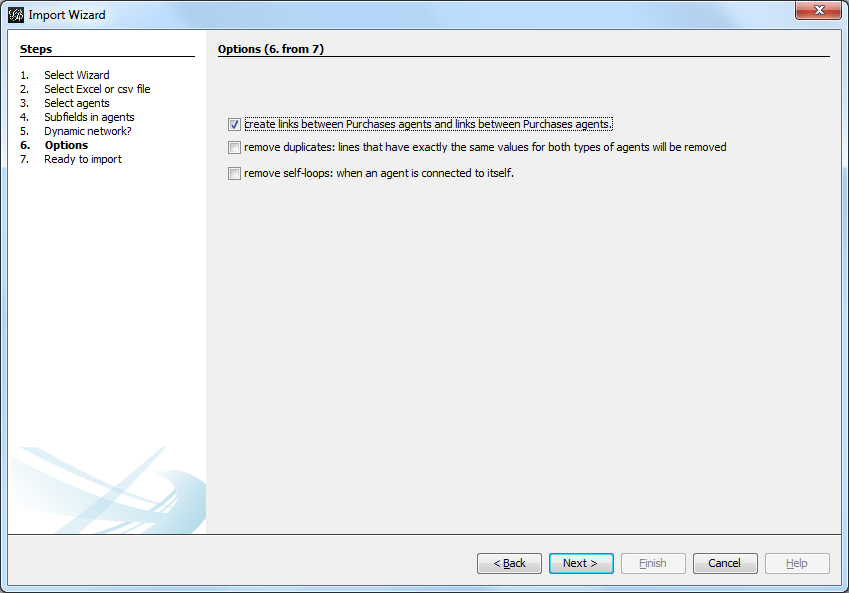
Figure 13. Options panel


"Create links between Purchases agents and links between Purchase agents"

→ If you chose a Product ←→ Product kind of network in panel 3, then of course you are interested in links between products. Check the box.

→ But if you chose a Client ←→ Product kind of network in panel 3, what you need is less obvious.

Let’s take the example of client I, who purchased a table and some chairs:

  1. Checking the box will create a network where:

graph g {
    rankdir="LR";
    a -- b [label=" purchased"]
    a -- c [label=" purchased"]
    b -- c [label=" co-purchased"]

     a [label="client I"];
     b [label="table"];
     c [label="chairs"];

}
  1. Not checking the box will create a network where:

graph g {
    rankdir="LR";
    a -- b [label=" purchased"]
    a -- c [label=" purchased"]

     a [label="client I"];
     b [label="table"];
     c [label="chairs"];

}
"Remove duplicates"

→ Check this option if your Excel or csv file has duplicate rows that you’d like to be removed

"Remove self-loops"

If a Client has purchased tables twice, so that we have "table, table" in a cell: this would create a link from table to table (a self loop).

→ Check this option if you’d like self loops to be removed.

7th panel

This panel recaps all the settings. Click on finish to create the network.

to go further

Visit the Gephi group on Facebook to get help,

Give a try to nocodefunctions.com, the web application I develop to create networks for Gephi. Click-and-point, free, no registration needed.

site
    stats