K-partite and Bipartite Graph (Multimode Networks Transformations)
2017-01-29
last modified: 2023-04-10
== !
Author and documentation
The Multimode Networks Transformations plugin allows you transform a k-partite graph into a mono-partite graph.
Official page of the plugin: https://gephi.org/plugins//plugin/semantic
Plugin Author: Jaroslav Kuchar
Licensed under: GNU GENERAL PUBLIC LICENSE
K-partite, Bipartite … What is it ?
Most of the time, when you create a graph, all the nodes are representing the same « kind » of object.
In a Social Network: Persons
In a Route Network: Bus Stops, Airports, Stations etc…
In a Geographical Network: Countries
But sometimes, you will encounter graphs that will have 2, 3 or multiple « kinds » of nodes where the links are almost exclusively going from one type to the other. These graphs are called Multipartite Graphs :
If you have 2 kinds of nodes, it’s a Bipartite Graph (or 2-partite)
Example : Social Network : Persons < - > Companies
If you have 3 kinds of nodes it’s a 3-partite Graph
Example : Movie Network : Actors < - > Movies < - > Movie Companies
If you have k kinds of nodes it’s a k-partite Graph
If you want a proper scientific definition, you can check the Wikipedia page about the subject.
The Dataset
We will use a well known data set : The Cac 40 Administrators relationship from www.citoyennumerique.fr.
The files for Gephi are accessible here : link::../resources/k-partite-bi-partite.zip[Gexf files]
The tutorial will be based on the SimpleGraph, but you also have access to the FullGraph to play with.
The CAC 40 represents the 40 most valuable company on the french stock market. A company has several administrators and nothing prevent an administrator to be in multiple companies. So the graph is build such as companies are sources of edges and targets are the administrators.
This is a typical bi-partite graph. If you look on the data, part of the node has a property type Administrator and the other part has a property type Company.
We can get quick observations:
Filtering by InDegree, we can check that Michel Pebereau and Jean-Martin Folz are in 5 companies at the same time.
Filtering by OutDegree, we can check that St-Gobain and Total have 8 administrators that are in other companies.
But that could be done without graph, an ordered list on excel would have done the job.
How to deal with multipartite graphs ?
Having a k-partite graph makes somehow the graph unfriendly to read. Usually, the metrics will be difficult to interpret, and generating a good visualisation from it won’t be trivial.
One method here is to reduce the bi-partite graph into a mono-partite graph.
By reducing, we will « lose » information but we gain in readability and synthesis, that’s part of the work in data visualisation to see at which level we want to go and how to deal with this trade of information. This will mostly be driven by the question you want to answer.
The principle of the reduction is to consider a type of nodes as edges and build a new graph based on this rule. In our example we have 2 ways to go:
Either we decide that the nodes of type « Company » are the edges. It will generate a "graph of Persons "
Either we decide that the nodes of type « Person » are the edges. It will generate a "graph of Company "
Here both graphs generated makes « sense » (network of entities) but it might appear that in some other case, one of the generated graphs won’t really be 'interesting'. That’s part of your work to judge this aspect.
Now, how to perform the transformation?
Using a Plugin
The easiest way is to use the link::https://marketplace.gephi.org/plugin/multimode-networks-transformations-2/[Multimode Network Transformation plugin]. The plugin is available on the Gephi app market and in the plugin manager in Gephi.
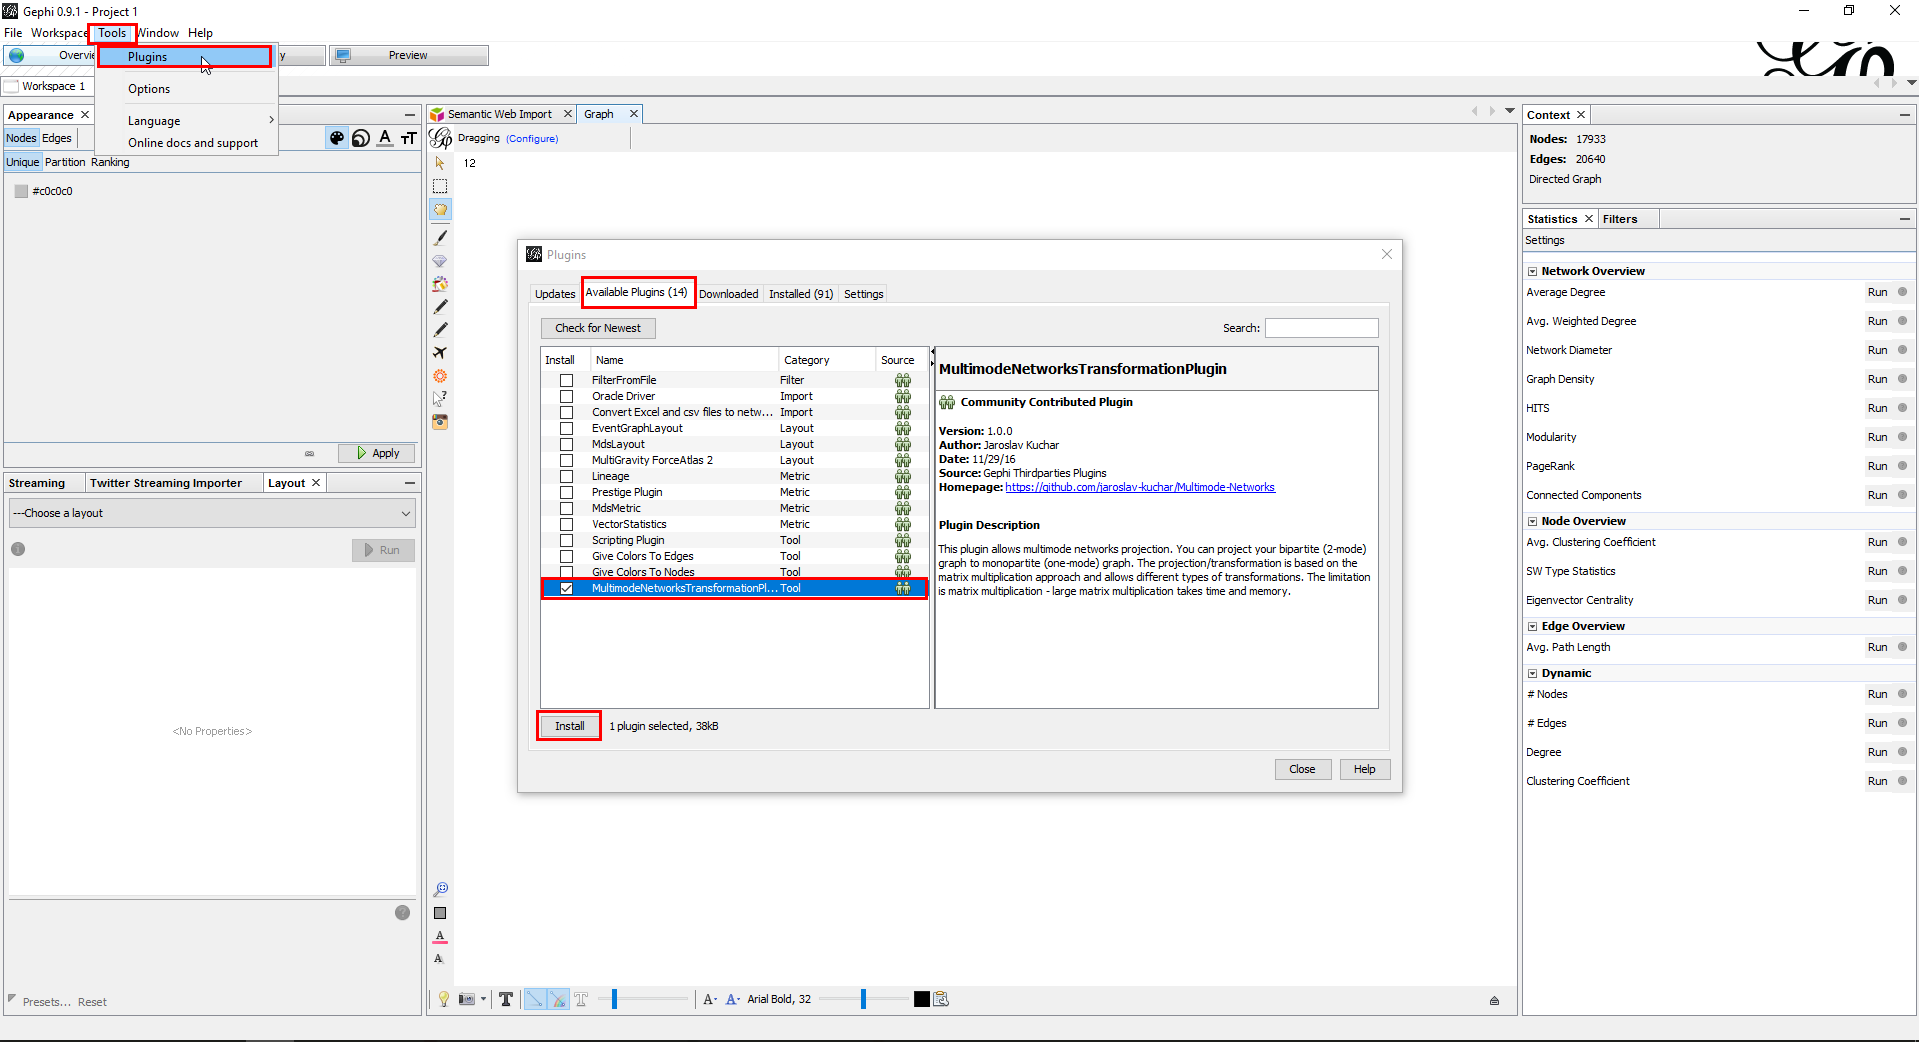
When it’s installed, you should be able to see or display the Multimode Network Transformation tab.
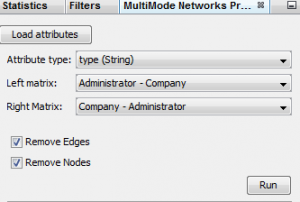
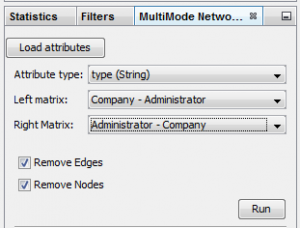
Then, load the graph and:
Click on Load Attributes and select Type on Attribute Type.
For left matrix select Administrator – Company and right matrix Company – Adminstrator
Enable Remove Edges and Remove Nodes, and Click** Run
The plugin will modify directly the graph on the current workspace. If you want to keep the original graph, be sure you have copied your workspace.
The plugins will actually to transform each relation like:
(Administrator)←(Company)→(Administrator)
to
(Administrator)←[{weight=Nb of Common Companies}]→(Administrator)
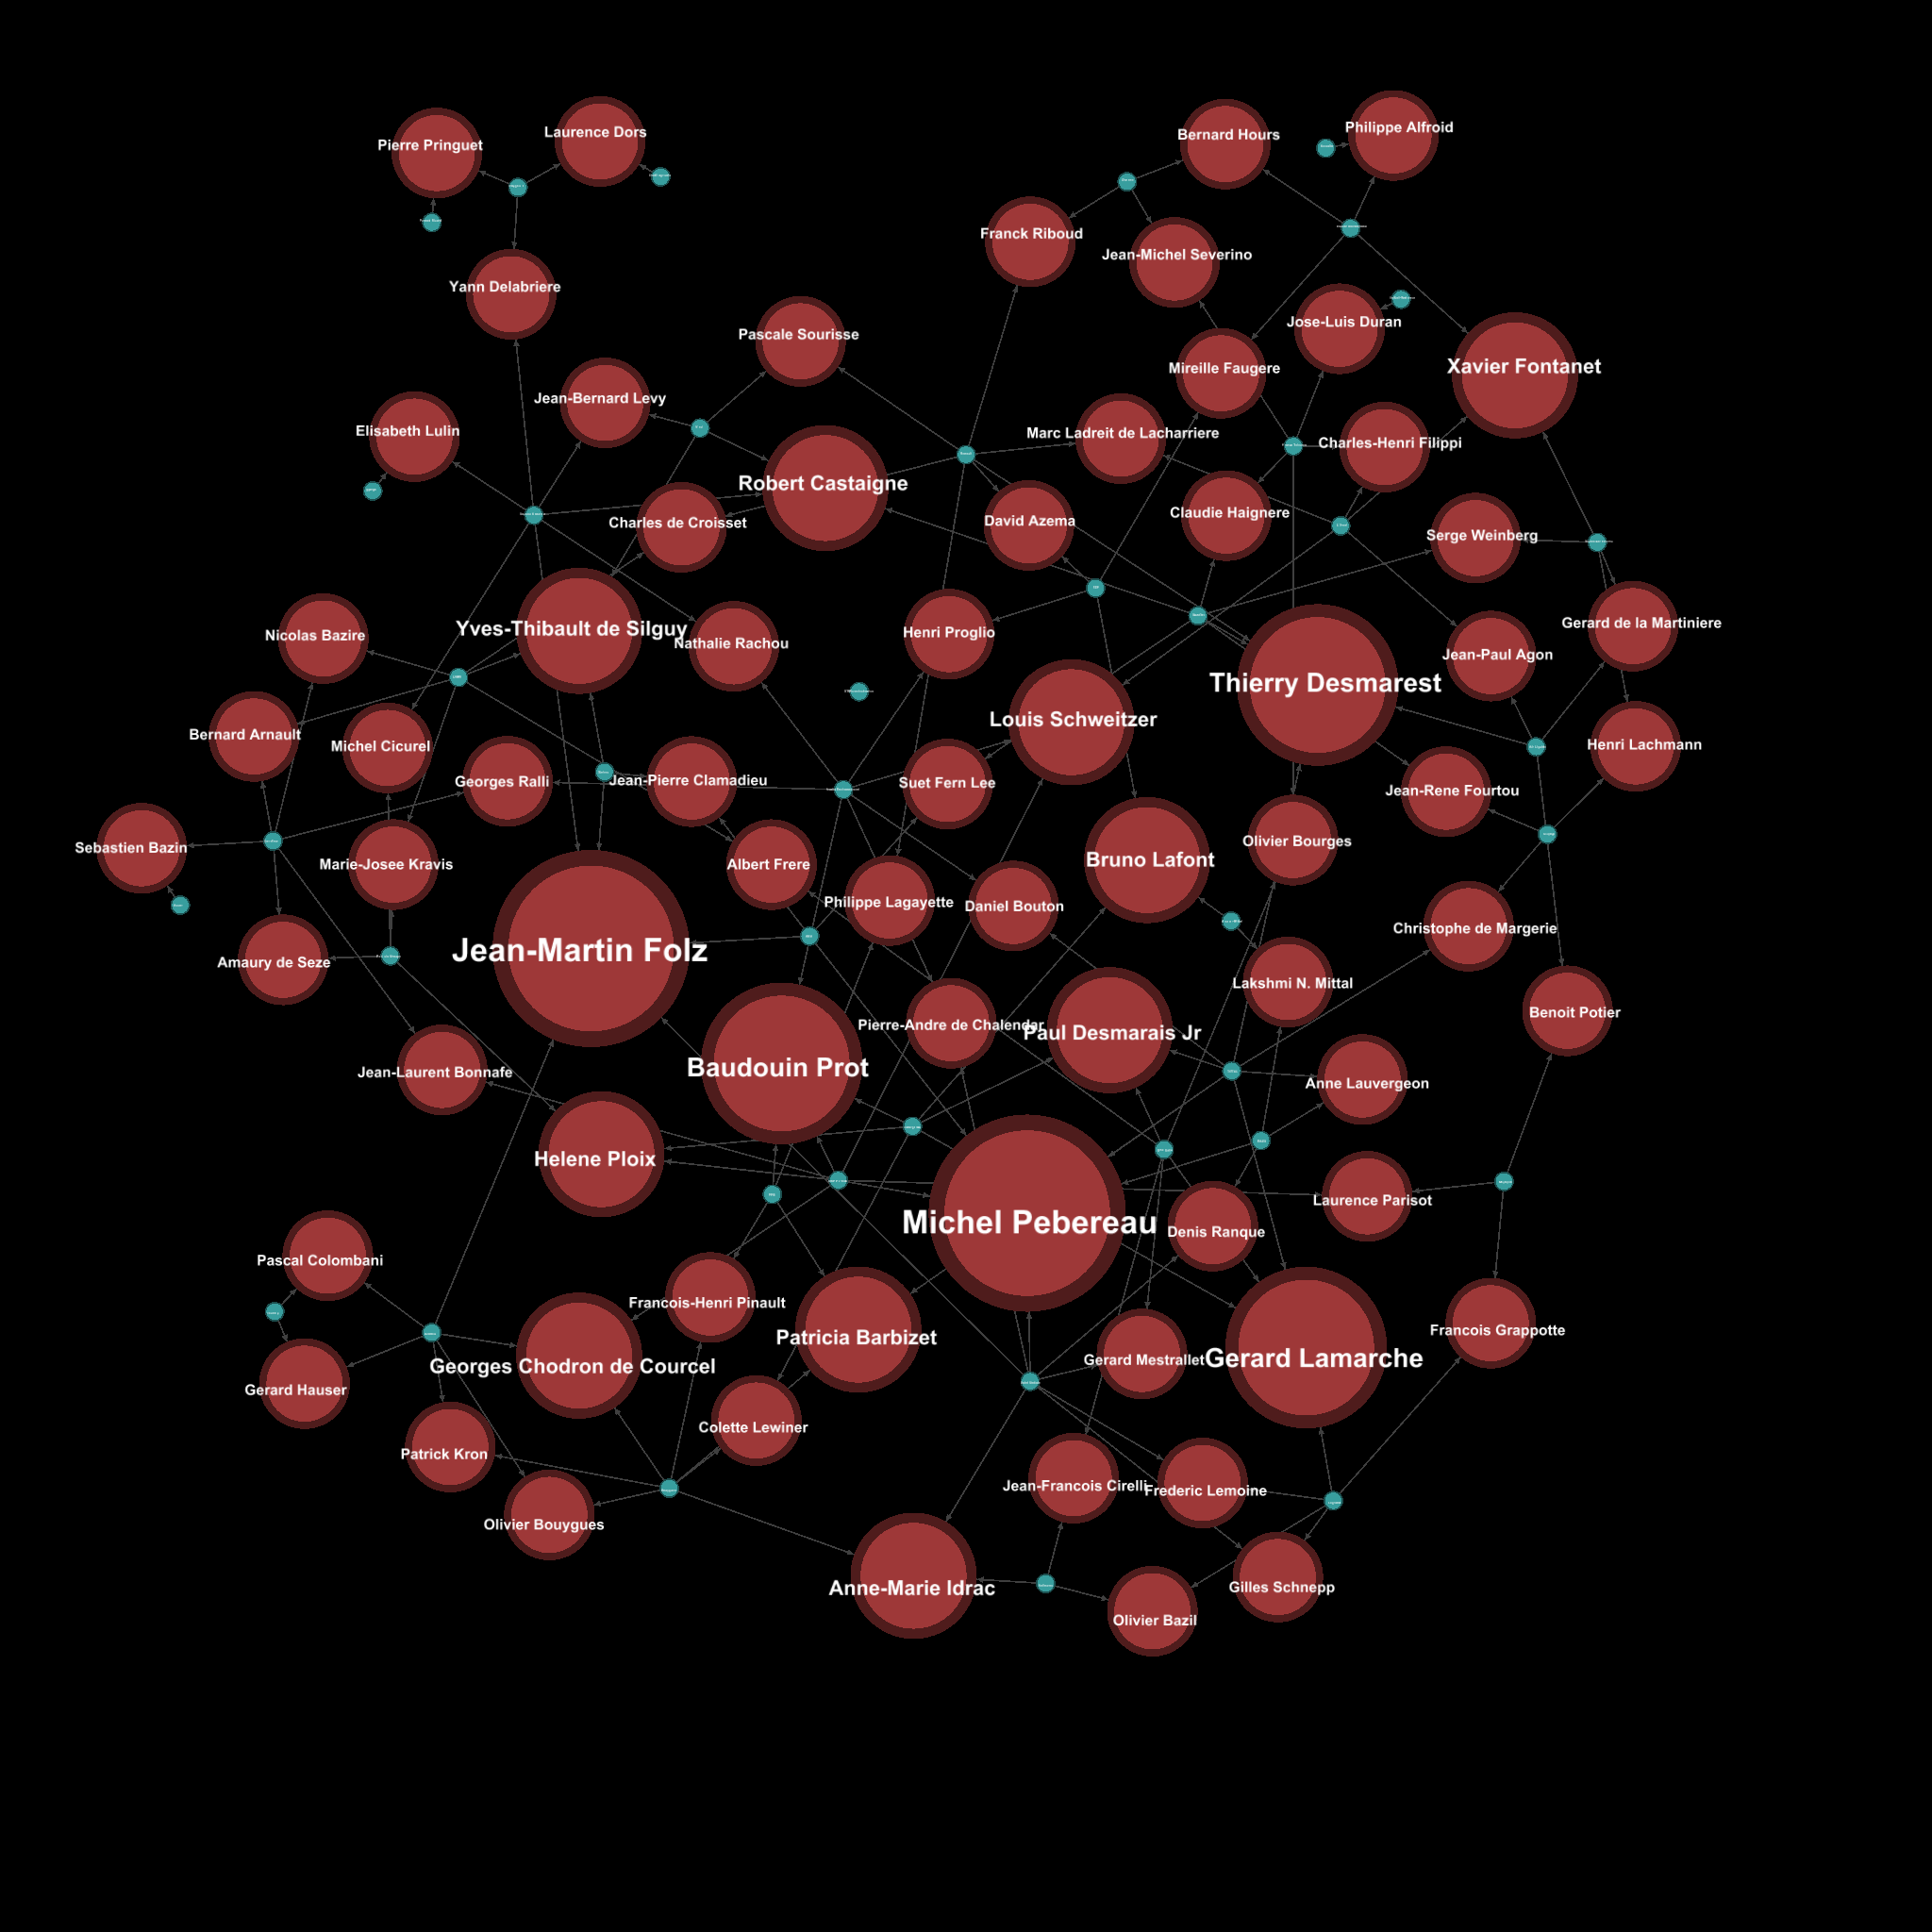
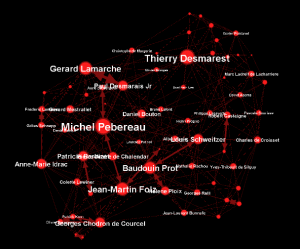
Now you should have a graph with only administrators on the graph preview.
To generate the relation between companies, replay the same steps from the original graph (duplicate the workspace0 again) and in the Multimode Network Transformation use :
Left Matrix : Company – Administrator
Right Matrix : Administrator – Company
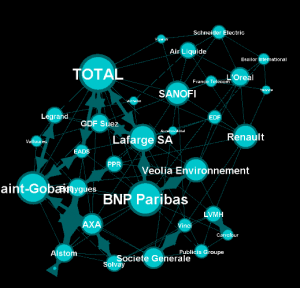
With the 2 new graphs, and playing with the weighted degree of the nodes, we are able to see some particularities:
The maximum of common administrator between company is 3: Bouygues and Alstom with Olivier Bouygues, Patrick Kron, Georges Chodron de Courcel
Half of the companies are sharing at least 2 administrators.
The maximum of common company between person is 3: Gerard Lamarche and Paul Demaray Jr see each other in Total, GDF Suez and Lafarge SA.
From all administrators that are in at least 2 companies, 1/3 of them are at least in the same 2 companies.
Theses statements could have been deduced from the original graph, but now, the information is more visible and accessible, especially if you want to share it to a large public.
The next steps are now mostly to look at graphs, and summarize all the particularities into some kind of output (poster, interactive graph, newspaper etc…)
Limitations
The plugin works quite well, but sometimes it has some limitation on large graphs. Or sometimes you may want to reduce your graph and have a custom metric computed. Then the only alternative to that is to use a script that will generate the graph for you.
Benefits
Multipartite graphs are complex to analyse, but synthesizing them to lower partite graphs gives you a better vision and insights about your data.
to go further
Visit the Gephi group on Facebook to get help,
or visit the website for more tutorials