first edition: 2017-11-01
1. Explaining machine learning in simple terms
a. A comparison with classic statistics
We will compare machine learning to a classic example from statistics: computing a regression line to identify a trend in a scatter plot.
To illustrate, we take some data about marketing budgets and sales figures in the corresponding period:
"Regular statistics" enables, among other things:
-
to find the numerical relation between the 2 series, based on a pre-established formal model (eg, ordinary least squares).
→ we see that sales are correlated with marketing spendings. It is likely that more marketing spending causes more sales.
-
to predict, based on this model:
→ by tracing the line further (using the formal model), we can predict the effect of more marketing spending
"Regular statistics" is advanced by scientists who:
-
are highly skilled in mathematics → their goal is to find the exact mathematical expression defining the situation at hand, under rigorous conditions
→ a key approach is inference: by defining a sample of the data of just the correct size, we can reach conclusions which are valid for the entire dataset.
-
have no training in computer science / software engineering
→ they neglect how hard it can be to run their models on computers, in terms of taking advantage of new types of hardward (ex: GPUs, see below).
→ since they focus on sampling the data, they are not concerned with handling entire datasets with related IT issues.
Machine learning does similar things to statistics, but in a slightly different way:
-
there is an emphasis on getting the prediction right, not caring for identifying the underlying mathematical model
-
the prediction needs to be achievable in the time available, with the computing resources available
-
the data of interest is in a format / in a volume which is not commonly handled by regular statistics package (eg: images, observations with hundreds of features)
Machine learning is advanced by scientists who are typically:
-
highly skilled in statistics (the "classic" statistics we have seen above)
-
with a training or experience in computer science, familiar with working with unstructured data / big data
-
working in environments (industry, military, …) where the operational aspects of the problem are key determinants (unstructured data, limits on computing resources) Machine learning puts a premium on techniques which are "computationally adequate":
-
which need the minimum / the simplest algebraic operations to run: the best technique is worthless if it’s too long or expensive to compute.
-
which can be run in such a way that multiple computers work in parallel (simultaneously) to solve it.
(footnote: so machine learning, in my opinion, shares the spirit of "getting things done" as was operations research in the early days)
The pursuit of improved models in traditional statistics is not immune to the notion of computational efficiency - it does count as a desirable property - but in machine learning this is largely a pre-requisite.
b. An illustration: the case of the GPU
A key illustration of the difference between statistics and machine learning can be provided with the use of graphic cards.
Graphic cards (also called GPUs: graphics processing units) are these electronic boards full of chips found inside a computer, which are used for the display of images and videos on computer screens:

In the 1990s, video gaming developed a lot from arcades to desktop computers. Game developers created computer games showing more and more complex scenes and animations. (see an evolution of graphics, and advanced graphics games in 2017).
These video games need powerful video cards (aka GPUs) to render complex scenes in full details - with calculations on light effects and animations made in real time.
This pushed for the development of ever more powerful GPUs. Their characteristics is that they can compute simple operations to change pixel colors, for each of the millions of pixels of the screen in parallel, so that the next frame of the picture can be rendered in milliseconds.
Millions of simple operations run in parallel for the price of a GPU (a couple of hundreds of dollars), not the price of dozens of computers running in parallel (can be dozens of thousands of dollars)? This is interesting for computations on big data!
If a statistical problem for prediction can be broken down into simple operations which can be run on a GPU, then a large dataset can be analyzed in seconds or minutes on a laptop, instead of cluster of computers.
To illustrate the difference in speed between a mathematical operation run without / with a GPU:
The issue is: to use a GPU for calculations, you need to conceptualize the problem at hand as one that can be:
-
broken into a very large series…
-
… of very simple operations (basically, sums or multiplications, nothing complex like square roots or polynomials)
-
… which can run independently from each other.
→ then, the calculations will be able to be done on a GPU, which can accelerate the treatment by 10x, 100x or more.
Machine learning typically pays attention to these dimensions of the problem right from the design phase of models and techniques, where classic statistics would typically not consider the issue, or only downstream: not at the design phase but at the implementation phase, which is too late.
Now that we have seen how statistics and machine learning differ in their approach, we still need to understand how does machine learning get good results, if it does not rely on modelling / sampling the data like statistics does?
Machine learning can be categorized in 3 families of tricks:
2. Three families of machine learning
a. The unsupervised learning approach
Unsupervised learning designates the methods which take a fresh dataset and find interesting patterns in it, without inferring from previous, similar datasets.
How does supervised learning work? Let’s take an example. In a wedding reception, how to sit people with similar interests at the same tables?
The set up:
-
a list of 100 guests, and 3 tastes you know they have for each of them
-
10 tables with 10 sits each.
-
a measure of similarity between 2 guests: 2 guests have similarity of 0% if they share 0 tastes, 33% if they share 1 taste, 66% with 2 tastes in common, 100% with three matching interests.
-
a measure of similarity at the level of a table: the sum of similarities between all pairs of guests at the table (45 pairs possible for a table of 10).
A possible solution using an unsupervised approach:
-
on a computer, assign randomly the 100 guests to the 10 tables.
-
for each table:
-
measure the degree of similarity of tastes for the table
-
exchange the sit of 1 person at this table, with the sit of a person at a different table.
-
measure again the degree of similarity for the table: if it improves, keep the new sits, if not, revert to before the exchange
-
And repeat for all tables, many times, until no exchange of sits improves the similarity. When this stage is achieved, we say the model has "converged" to one of the best possible solutions.
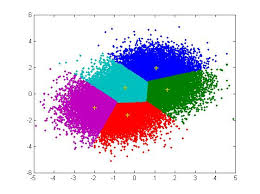
This approach makes it possible to identify groups of people who have common points. It is obviously very useful to organize the world around us in business, from a segmentation of customers or prospects, to a classification of products in categories for evaluation or portfolio management purposes. There is a very large field of scientific research devoted to designing better clustering techniques suiting a variety of situations. One of the most popular of these techniques remains the"k-means", and was invented in the 1950s:
b. The supervised learning approach
Supervised learning is the approach consisting in calibrating a model based on the history of past experiences, in order to predict a new occurrence of the same experience with great accuracy. Let’s take an exmple.
Imagine we collected from Instagram 50,000 images of cats and dogs.
-
an image of a cat, with the hashtag "#cat"
-
an image of a dog, with the caption "#dog"
-
another image of a cat, with the caption "#cat"
etc….
-
This collection of 50,000 images with their captions is called the training set.
-
this is also called a labelled dataset, meaning that we have a label describing each of the observation.
|
In a training set, where do the labels come from?
|
The challenge for the computer / software is this one: if we get a new image of a cat without a caption, will it be able to guess the label "cat"?
Supervised learning proceeds this way:
-
take a list of random coefficients (in practice, the list is a vector, or a matrix).
-
for each of the 50,000 pictures of dogs and cats:
-
apply the coefficients to the picture at hand (let’s say we have a dog here)
-
If the result is "dog", do nothing, it works!
-
If the result is "cat", change slightly the coefficients.
-
move to the next picture
-
-
After looping through 50,000 pictures the coefficients have hopefully converged. This was the training of the model.
Now, when you get new pictures of cats and dogs (the fresh set), applying the trained model should output a correct prediction (label "cat" or label "dog").
Supervised learning is currently the most popular family of machine learning and obtains excellent results especially in image recognition, even though some cases remain hard to crack:
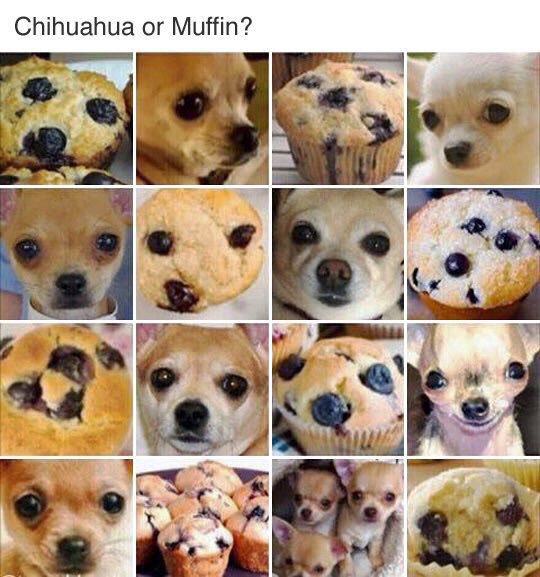
(source)
It is called supervised learning because the learning is very much constrained / supervised by the intensive training performed:
→ there is limited or no "unsupervised discovery" of novelty.
Important take aways on the supervised approach:
-
collecting large datasets for training is key. Without these data, no supervised learning.
-
the training set should be specific: if you want the software to learn how to "recognize" cats and dogs, you should train it with pictures of cats and dogs, not pictures from random animals.
-
supervised learning is not good at analyzing situations entirely different from what is in the training set.
c. The reinforcement learning approach
To understand reinforcement learning in an intuitive sense, we can think of how animals can learn quickly by ignoring undesirable behavior and rewarding desirable behavior.
It’s easy and only takes a few seconds. The following video shows B. F. Skinner, a central figure in behavioral psychology in the 1950s-1970s, who teaches a pigeon how to turn around. For this, Skinner proceeds simply by rewarding the pigeon with seeds, as soon as the pigeon makes rotational movements. At the end, the pigeon finally made a complete turn on himself, because he learned that it would give him a reward.
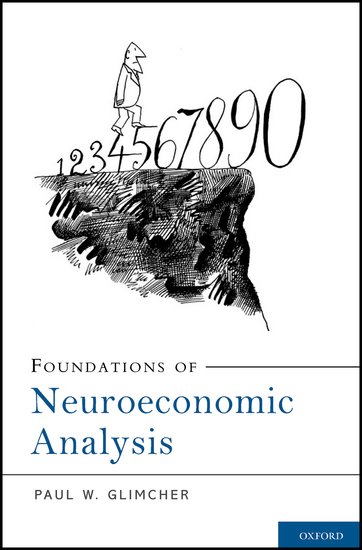
Footnote: how does this apply to learning in humans? On the topic of learning and decision making, I warmly recommend Foundations of Neuroeconomic Analysis by Paul Glimcher, professor of neuroscience, psychology and economics at NYU:
|
this is a very hard book to read as it covers three disciplines in depth. The biological mechanisms of decision making it describes can be inspiring to design new computational approaches. |
Besides pigeons, reinforcement learning can be applied to any kind of "expert agents".
Take the case of a video game like Super Mario Bros:

Structure of the game / the task:
-
Goal of the task: Mario should collect gold coins and complete the game by reaching the far right of the screen.
-
Negative outcome to be avoided: Mario getting killed by enemies or falling into holes.
-
Starting point: Mario Bros is standing at the beginning of the game, doing nothing, at the far left of the screen.
-
Possible actions: move right, jump, stand & do nothing, shoot ahead.
Reinforcement learning works by:
-
Making Mario do a new random action ("try something"), for example: "move right"
-
The game ends (Mario moved right, gets hit by a enemy)
-
This result is stored somewhere:
-
if Mario moved to the right = good (because the goal of the game is to go completely to the right)
-
getting hit by an enemy or falling in a hole = bad
-
-
Game starts over (back to step 1) with a a combination of
-
continue doing the actions that were recorded as positive in step 3
-
try something new (jump, shoot?) when close to a situation associated with a negative outcome in step 3
-
After looping from 1. to 4. thousands of times, Mario memorizes all the actions to do to complete the game, without any human player:
Reinforcement learning is perceived as corresponding to an important side of human learning / human intelligence (goal oriented, "trial and error").
Now, let’s imagine that we create a game in which two learning machines are competing: one that controls Mario Bros, the other who controls an enemy character in the game, and tries to defeat Mario Bros. By having them battle thousands of rounds and adapt their behavior by learning from their mistakes, the two will learn much faster and improve a lot more than by reinforcement learning alone. This type of artificial intelligence is called "generative antagonistic networks" and many observers see a bright future for it in AI.
d. When is machine learning useful? When is it not?
Using machine learning can be a waste of resource, when well known statistics could be easily applied.
Hints that "classic" statistical modeling (maybe as simple as a linear regression) should be enough:
-
The dataset is not large (below 50k observations), supervised learning is not going to work
-
The data is perfectly structured (tabular data)
-
The data points have few features
Finally, there is a situation in which machine learning is absolutely not the right solution. If the question is that of the role of this or that factor in the determination of a result, machine learning remains silent on this subject. Let’s take the example of pictures of cats and dogs:
-
supervised learning is very effective to "guess" if an image is that of a cat or a dog, after training on thousands of images of cats and dogs.
-
but nothing tells us "how" supervised learning has done its job. Does the length of the whiskers, the shape of the ears, the color of the hair … help to classify an image like that of a cat or a dog? Supervised learning does not answer these questions.
-
Works have been published to make intelligible how supervised learning determines the result "cat" or "dog". However this type of work remains quite uncommon. Supervised learning remains largely a black box.
3. What relation between machine learning and data science?
Machine learning is one of the steps in the broader chain of steps in data processing.
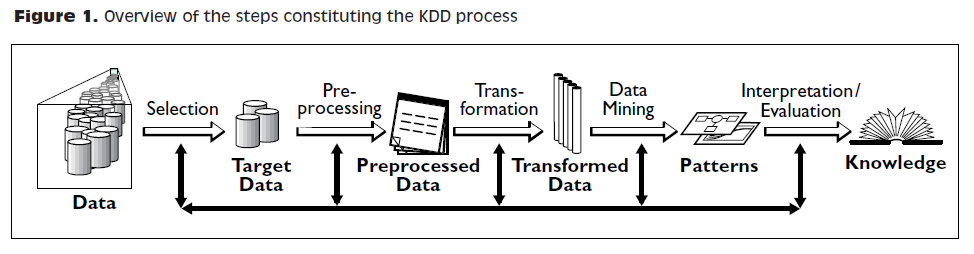
The chain of data processing consists in collecting data, storing it, analyzing it to discover some isnsights, and finally delivering a result. This chain of processing was not invented in the 2000s, and has ressemblance to the concept of kdd: "Knowledge Discovery in Databases" from the 1990s:
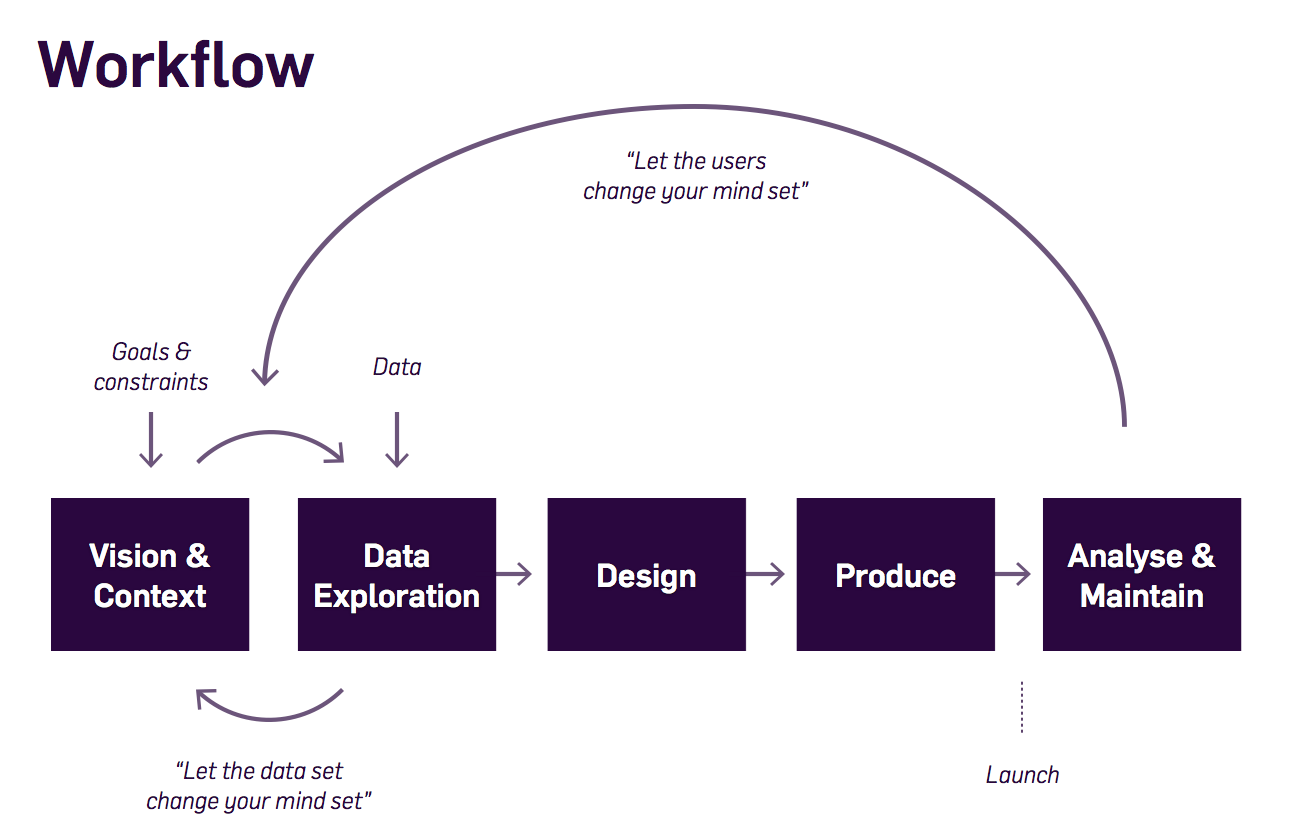
More recent representations of the steps in data processing have been suggested, making room for the role of data visualization:
→ see the information design process by Ben Fry and this data visualization workflow by Moritz Stefaner:
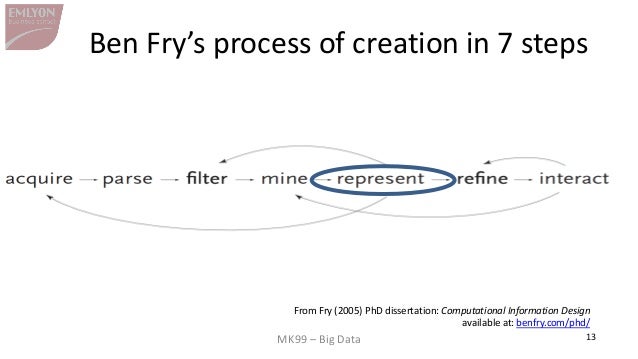
-
Machine learning is one of the techniques that intervenes at the step of "Data mining".
-
Data science designates either the "data mining" step (when it is used narrowly), or the whole data processing chain (when it is used broadly).
To perform the entire chain of data processing, a large variety of skills is needed:
-
capacity to setup up the IT infrastructure to collect, store and access large volumes of data ("data engineer", "back end" types of skills)
-
capacity to apply maths and statistical models to the data ("data scientist" ,"data mining" types of skills)
-
capacity to communicate the results effectively ("data visualization", "front end" types of skills)
The skills of a data scientist are often represented as the meeting of three separate domains:
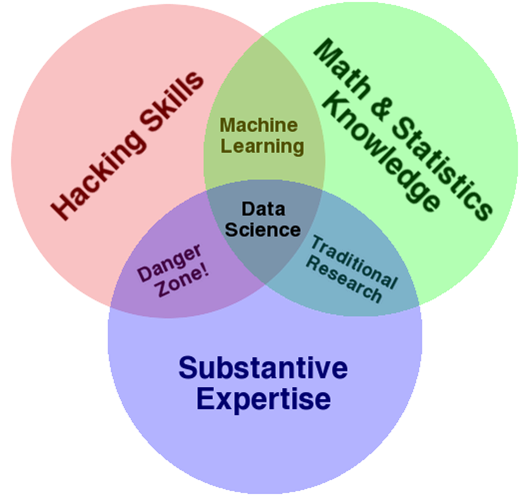
This diagram makes an important point: data science is not just a set of IT and maths skills. "Substantive expertise", also known as "domain knowledge", is also required: people who know intimately about the context of the application being developed. In practice, this balance of skills is rarely found in just one individual. It is achieved by creating data science teams which include IT staff, analysts and people from the business.
4. Machine learning and Artificial intelligence (weak and strong)
a. Weak vs Strong AI
Weak AI designates computer programs capable of surpassing humans in complex tasks on a narrow and precisely delimited domain (such as playing chess). Weak AI works through expert systems or with machine learning techniques as seen above. The AI applications we see all around us are weak AI: driving aids and autonomous vehicles, chatbots, computers capable of beating humans at go or Mario Bros, …
Strong AI is an intelligence that would be able to solve problems of general scope, able to set its own goals, to be aware of itself, or to solve problems of varied and original natures. Today, nothing approaches this and the consensus says that current machine learning techniques are not adapted to create this type of intelligence.
This means that talks on current applications of AI mean we actually discuss weak AI, which is largely synonymous with machine learning.
b. Videos to understand AI further
-
"A DARPA perspective on Artificial Intelligence" by John Launchbury, Director of DARPA’s Information Innovation Office (I2O) in 2017: https://youtu.be/-O01G3tSYpU
-
"AI: What’s Working, What’s Not" by Frank Chen from Andreessen Horowitz in 2017: https://youtu.be/od7quAx9nMw
c. To go further: a dense slideshow on the state of AI in 2018
This presentation is by Ian Hogarth and Nathan Benaich.
The end
Find references for this lesson, and other lessons, here.

This course is made by Clement Levallois.
Discover my other courses in data / tech for business: https://www.clementlevallois.net
Or get in touch via Twitter: @seinecle