last modified: 2023-05-15
1. Definitions
A network is a dataset made of entities and their relations
Scientists use the term "graph" to discuss networks.
a. Social networks
As users, we are very familiar with one type of networks - social networks:


b. Other networks
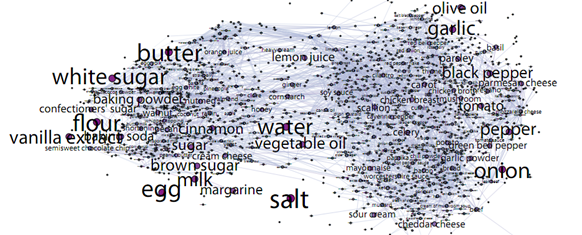
It is important to realize that networks cover more than relations between humans. For example, it is possible to imagine a network made out of cooking recipes. 2 ingredients are connected if they appear frequently in the same recipes.
Scanning all recipes and their ingredients from a website of cooking recipes, this gives:
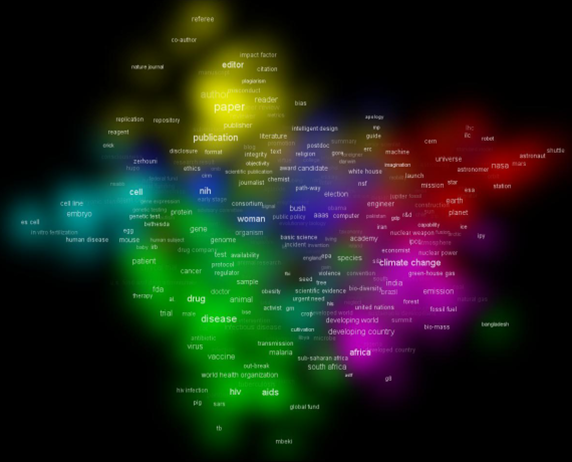
Semantic networks are another broad category of networks. The method is the same: we need to find a way to "relate" words in a text, then we get a network. The general idea is the same as in cooking recipes: 2 terms of a text will be connected in the network if they frequently appeared in same paragraphs.
c. How big can networks be?
With a surge in computing power in the age of big data, and the adequate NOSQL databases (such as Neo4J or OrientDB), we can deal with huge networks:
For example, “The Anatomy of the Facebook Social Graph” (2011)
→ study of 721 million active Facebook users and the 69 billion (!) friendship links connecting them.
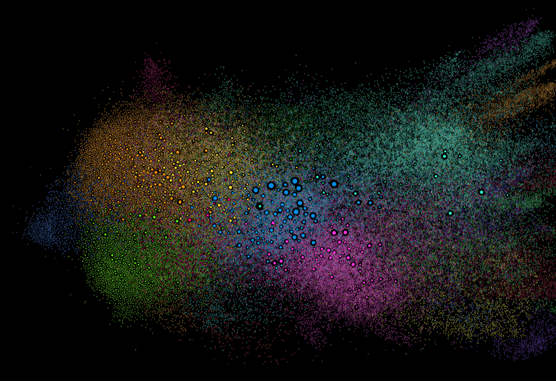
A limit is quickly reached in terms of visualization: it is hard to fit millions of nodes on a screen. In the next visualization, we can see a network of 90,000 Swedish speakers and their relations on Twitter. The view is very cluttered.
(open the source for an interactive version)
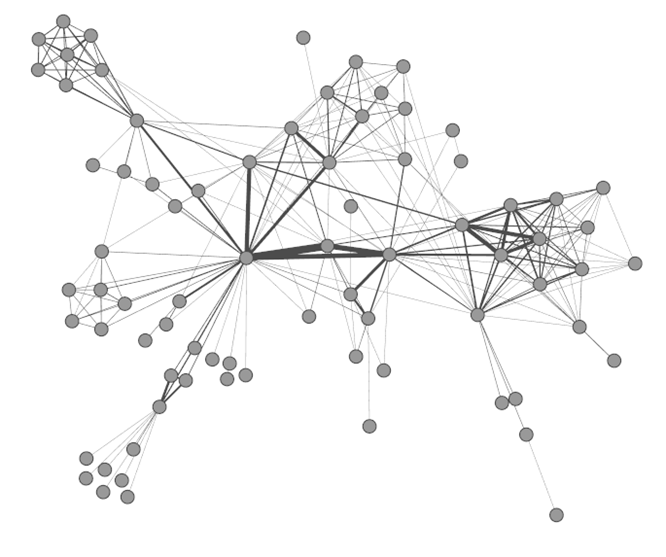
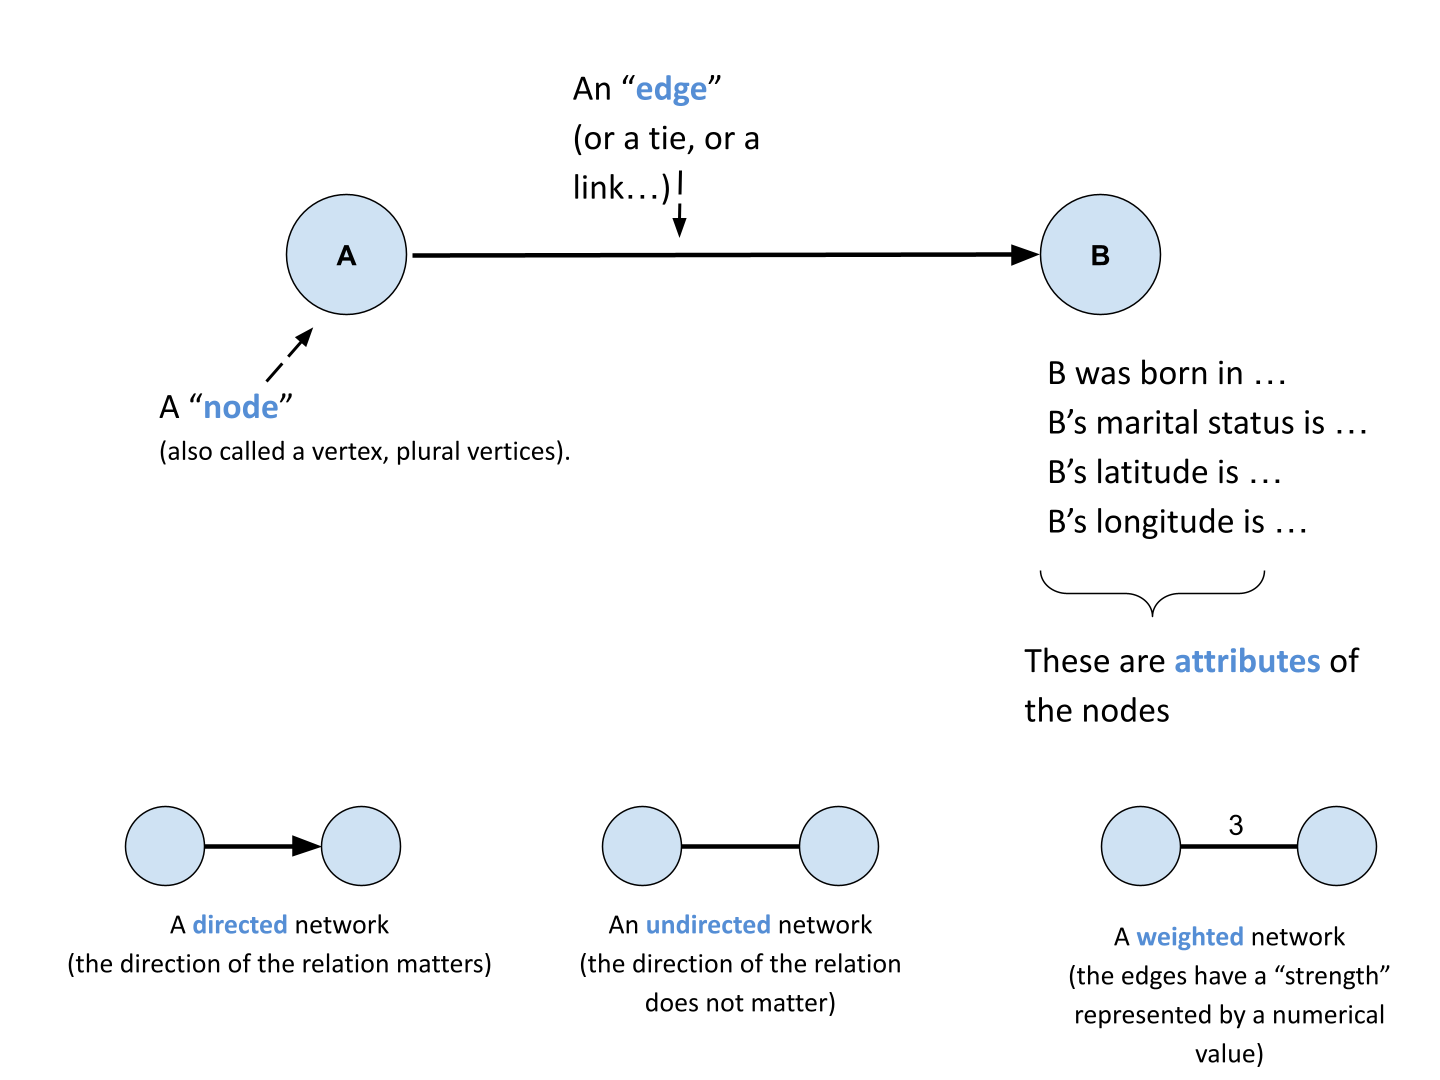
d. How to discuss networks? Some vocabulary
2. Networks: what use for business?
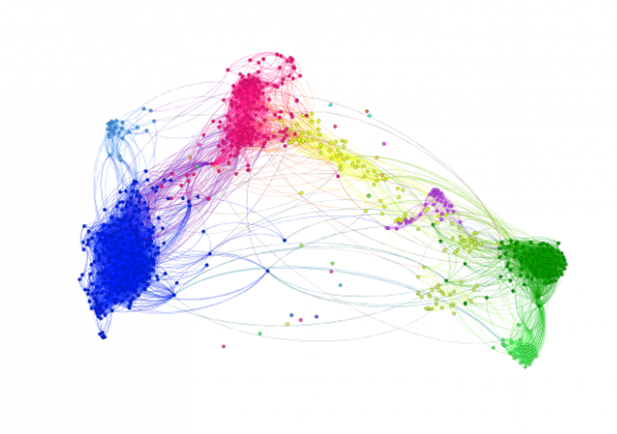
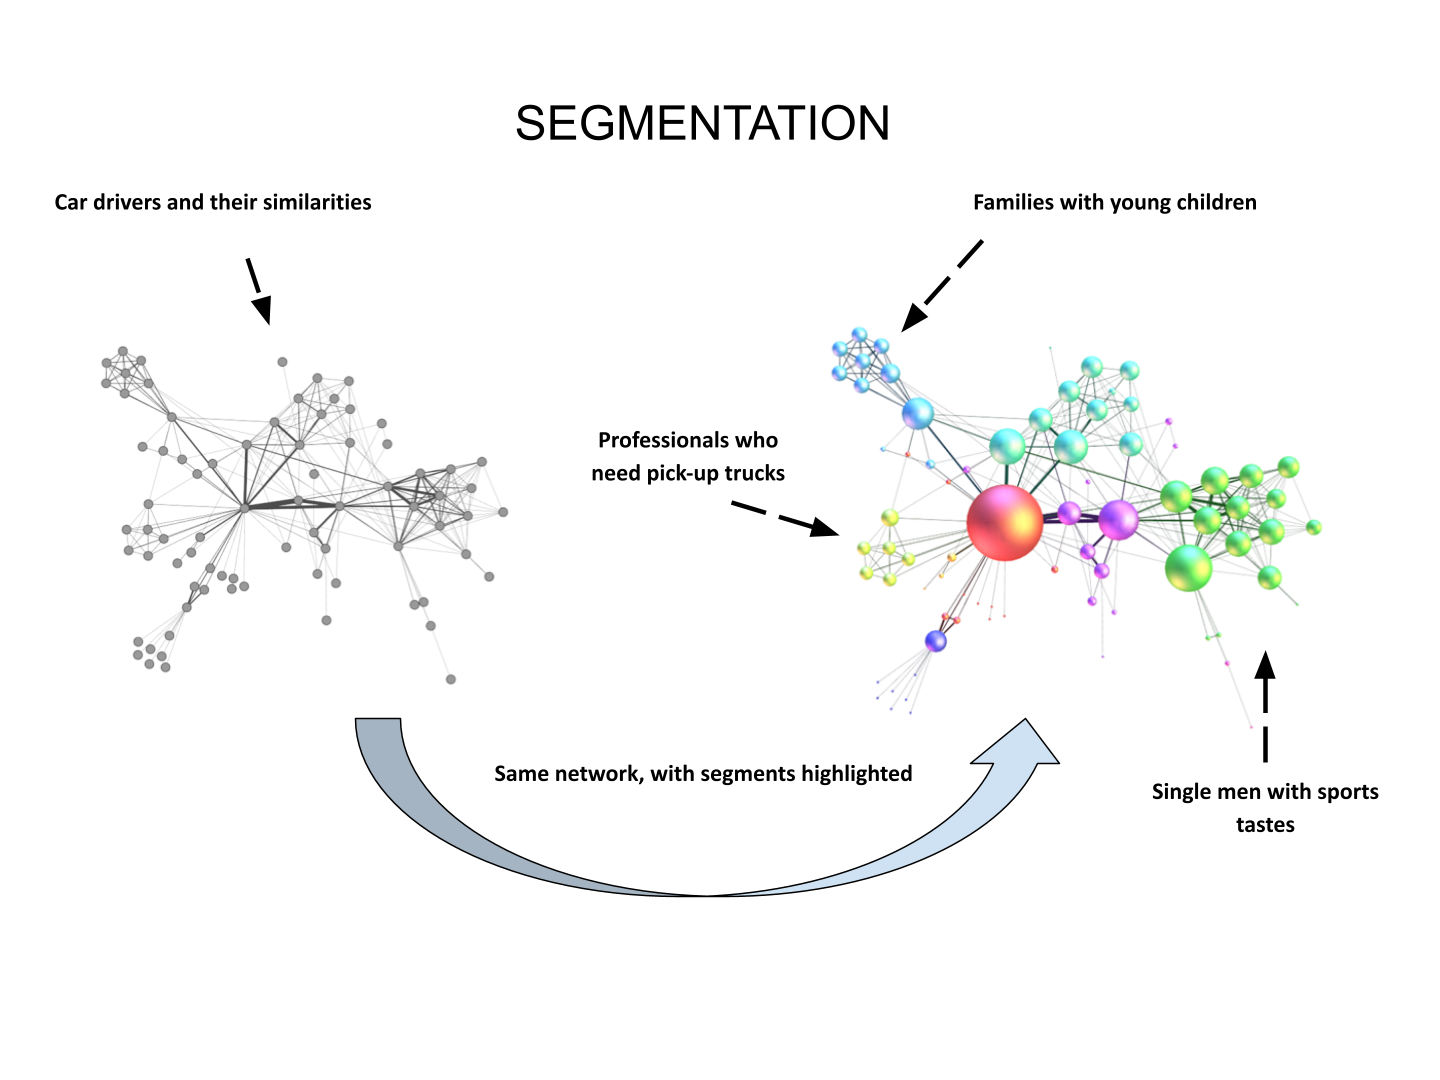
a. Segmentation
If a network is made of entities and their relations, then a segment is a subgroup of entities in the network, which has some cohesion or something in common.
This subgroup of nodes in the network is often called a "community".
Detecting communities in a network, also called "clustering", consists in finding nodes that have many connections in common.
This is a mathematical and algorithmic procedure, but it is very simple to understand visually:
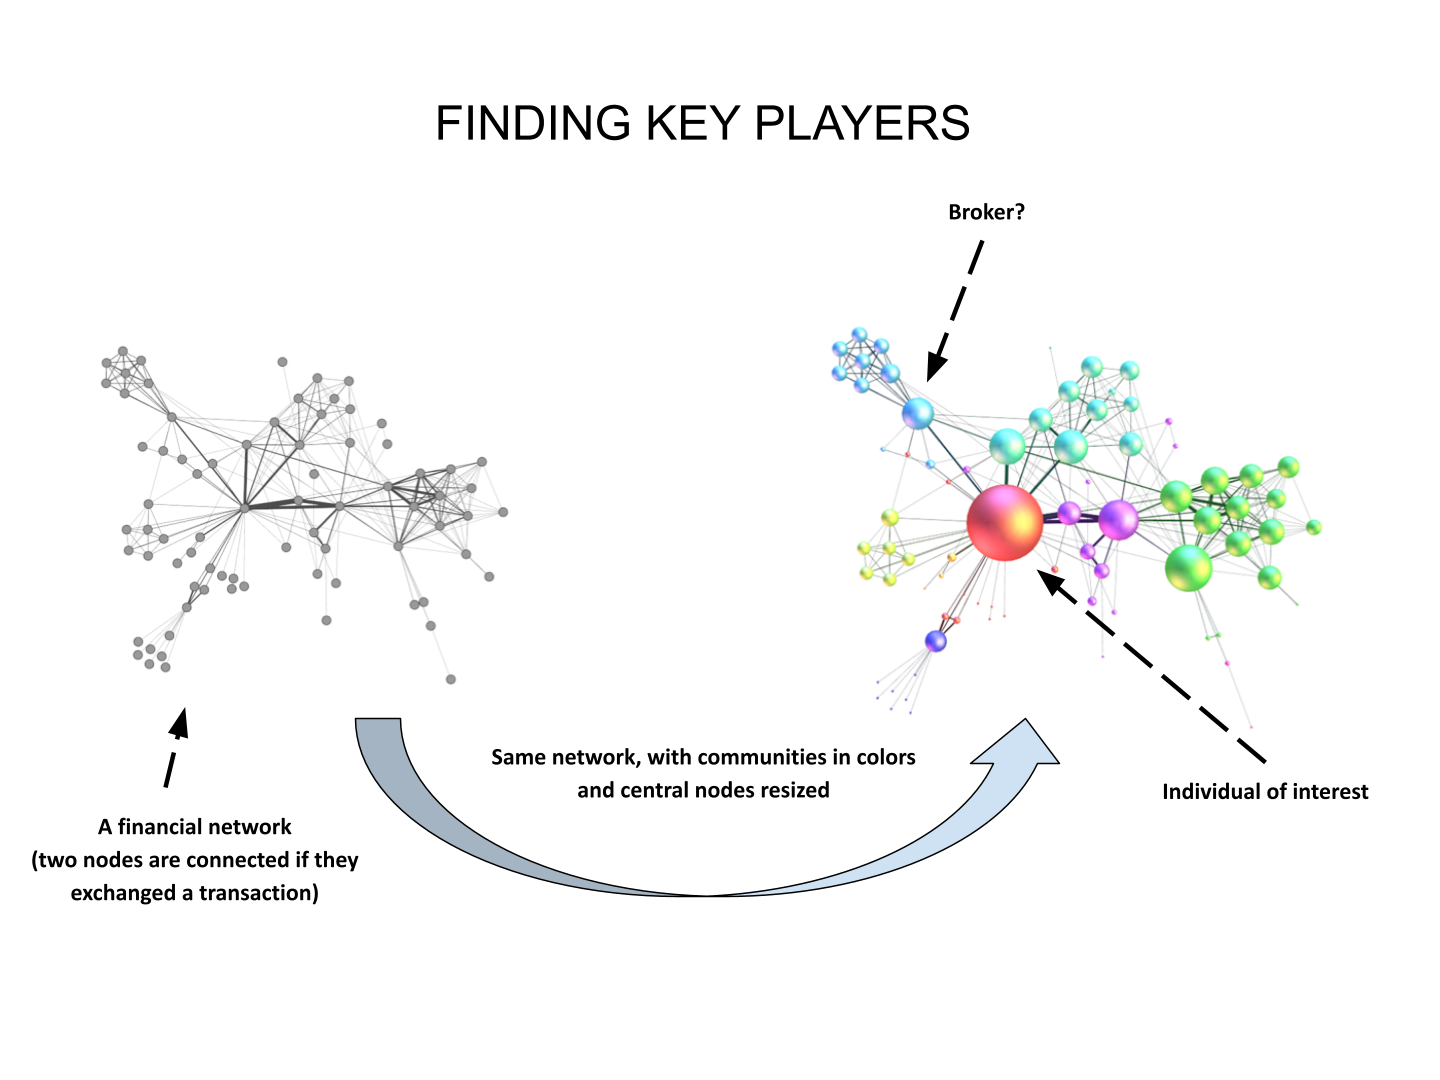
b. Finding key players
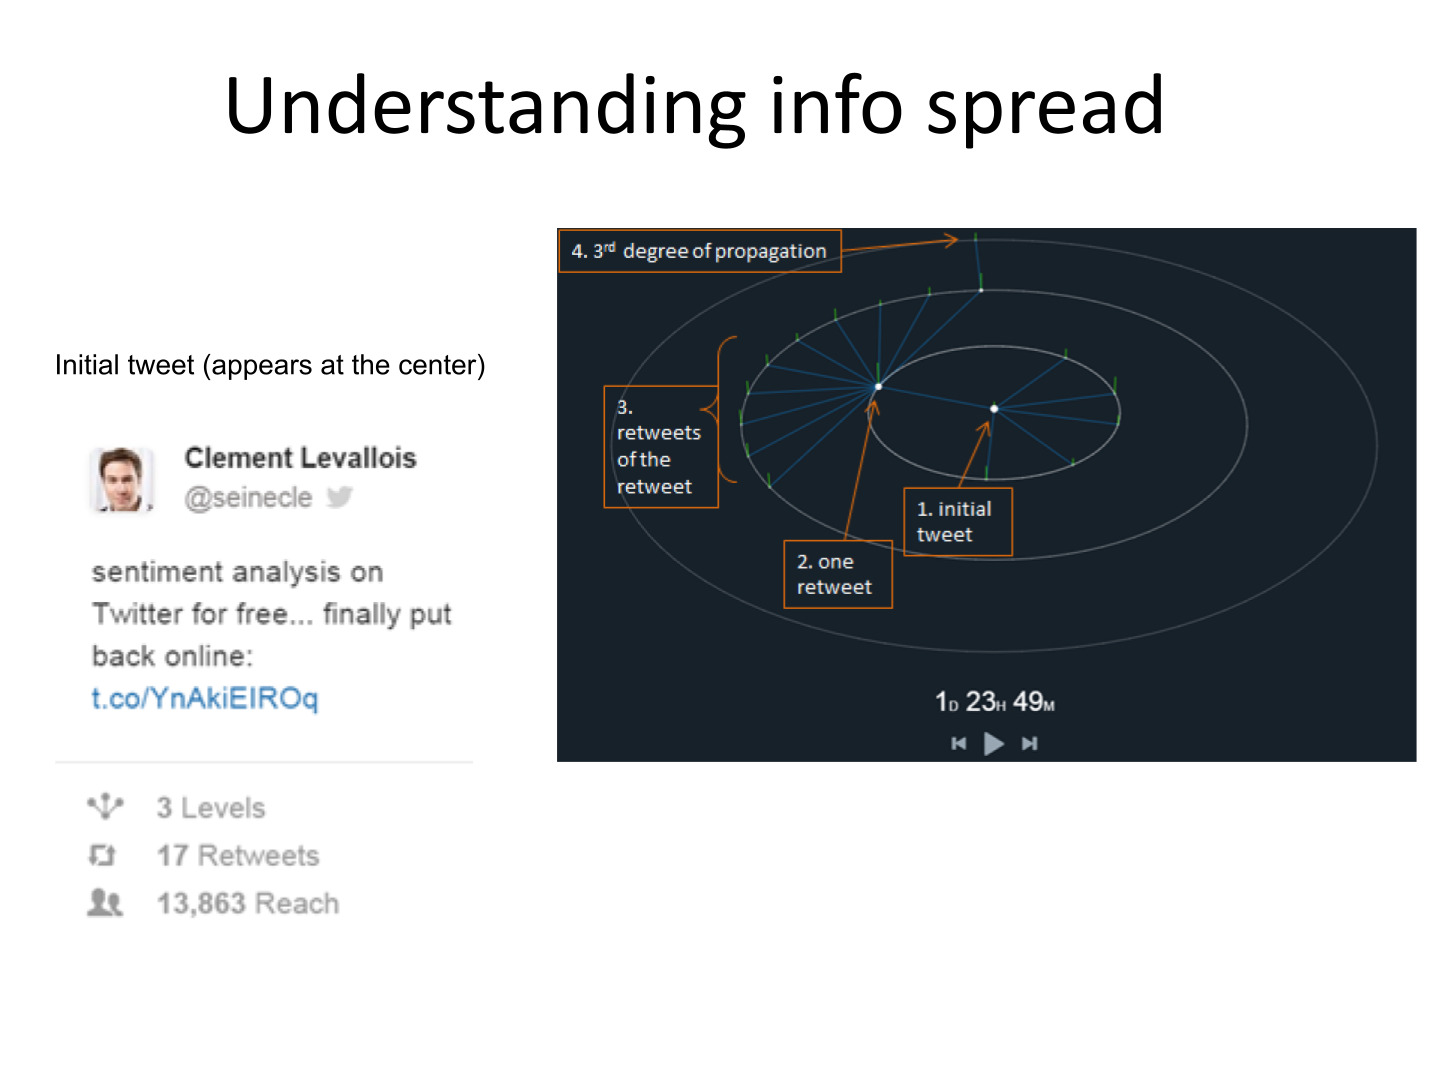
c. Understanding how information spreads
A data science company created "Where does my tweet go", which traces how a given tweet spreads through retweets. The service is now discontinued (Twitter datan was too expensive to buy) but the mechanism can be explained:
d. Identifying patterns - for fraud detection, control or intelligence.
In the following video, we see participants in the money market (short term loans between banks) in Europe. 2 banks are connected if one lends to the other. The pattern of exchanges shifts through years - banks withdraw from the market.
Another example: connecting seemingly unrelated measures of business performance with Oracle BI and Linkurious:
3. To go further
You can also visit my tutorials on Gephi, the leading software to visualize large graphs:
The end
Find references for this lesson, and other lessons, here.
 This course is made by Clement Levallois.
Discover my other courses in data / tech for business: https://www.clementlevallois.net
Or get in touch via Twitter: @seinecle