Segmentation
between marketing and data science
2017-20-08
last modified: 2023-05-15
== !
1. The role of segmentation in marketing
a. The need for a market fit
How to market the right product to the right people?
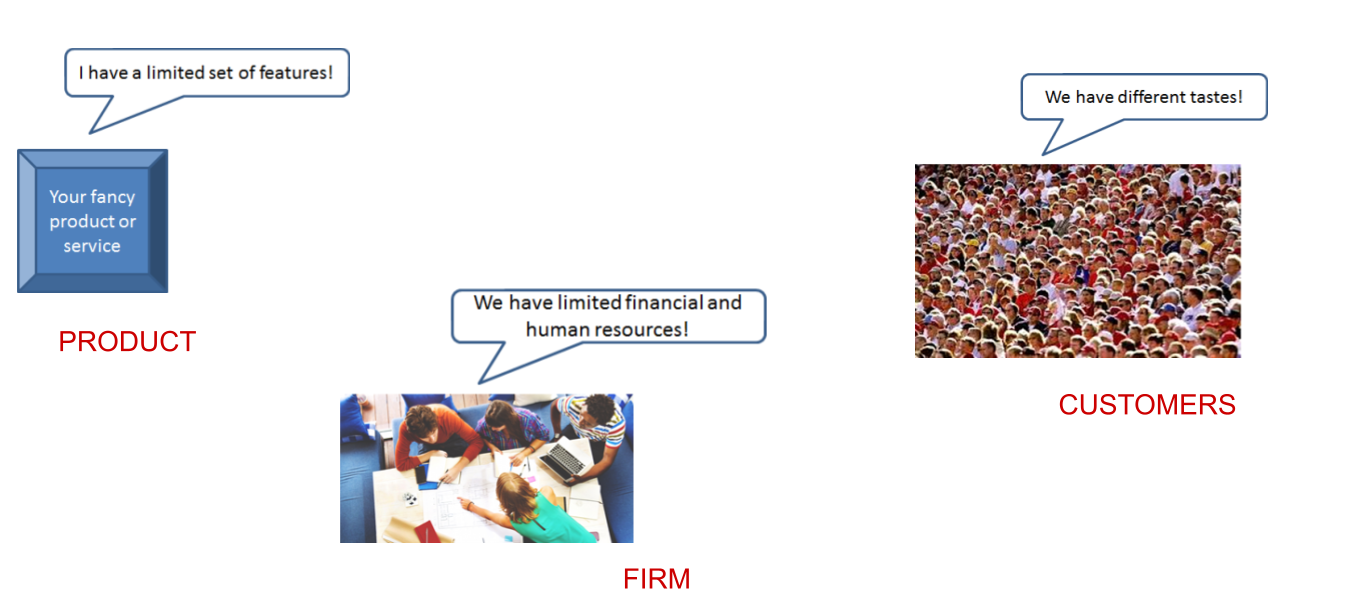
A product cannot have every feature: adding a new feature can conflict with existing features or just hurt the need for simplicity.
Customers have diverging expectations: what is preferred by one customer is considered a nuisance by another.
Firms have limited resources: they cannot create and sell every variety of a product with every feature. They must allocate their scarce resources in the best way possible.
A market fit is achieved when there is an alignment between the product, the customers needs and the firms capabilities to deliver.
How to achieve a market fit?
This question is a classic field of study in marketing, and is called "market research". A market fit can be explored and found with the "STP" approach:
b. Segmentation and STP
STP stands for: Segmentation → Targeting → Positioning
This a strategy to arrive at a market fit.
Once defined, this strategy will be implemented following a marketing plan (for example, following the famous "4Ps").
Let’s have a closer look at the "STP":
SEGMENTATION First, cut the crowd into segments of customers with similar characteristics / expectations / needs
TARGETING Then, evaluate each segment, and select the most attractive one.
POSITIONING Creating an offer (a value proposition) corresponding to the segment we target
"Segmenting a market" is the first step of this STP strategy.
It is the key operation where the "anonymous crowd of potential buyers" is analyzed and cut into distinct groups which can be interested in the same kind of product or service.
2. How to segment, in practice?
a. Quantitative vs qualitative methods
Qualitative and quantitative methods can be used for segmentation.
Qualitative methods include surveys, ethnographic observation (online or offline), literature reviews on socio cultural trends, text analysis, interviews, focus groups, and more.
The point of these qualitative methods is to identify typical usages and attitudes towards the product (aka, use cases) among potential customers. Each of these use cases is a potential segment to address.
Qualitative methods are strong at identifying segments, and also strong at understanding and explaining them: we understand better why people make their choices.
Qualitative methods are not strong at evaluating the size and at generalizing beyond the circumstances of the observations made.
In comparison, quantitative methods are relatively stronger at measuring, comparing and generalizing.
Quantitative methods put numbers on things, allowing for an estimation of absolute and relative mangitudes: is this segment a large one? The largest?
And contrary to qualitative methods, quantitative methods are good at projecting a small sample to a larger situation, all while measuring by how much we can be off - that’s what statistics do.
But let’s not forget about 2 relative weaknesses of quantitative studies compared to qualitative ones:
correlations are easy to find, causality is harder to prove.
explanations (causality + motives → the why?? question) are also hard to establish.
→ we detail some of these quantitative methods below.
b. Methods for segmentation in data science: "clustering"
(we use "data science methods" here, but that’s very close to "machine learning techniques". See the chapter on AI, data science and machine learning)
Many overviews of ML techniques tend to have a special category for "clustering techniques" (overview of ML 1, overview of ML 2, overview of ML 3).
For example at the bottom right of this chart:
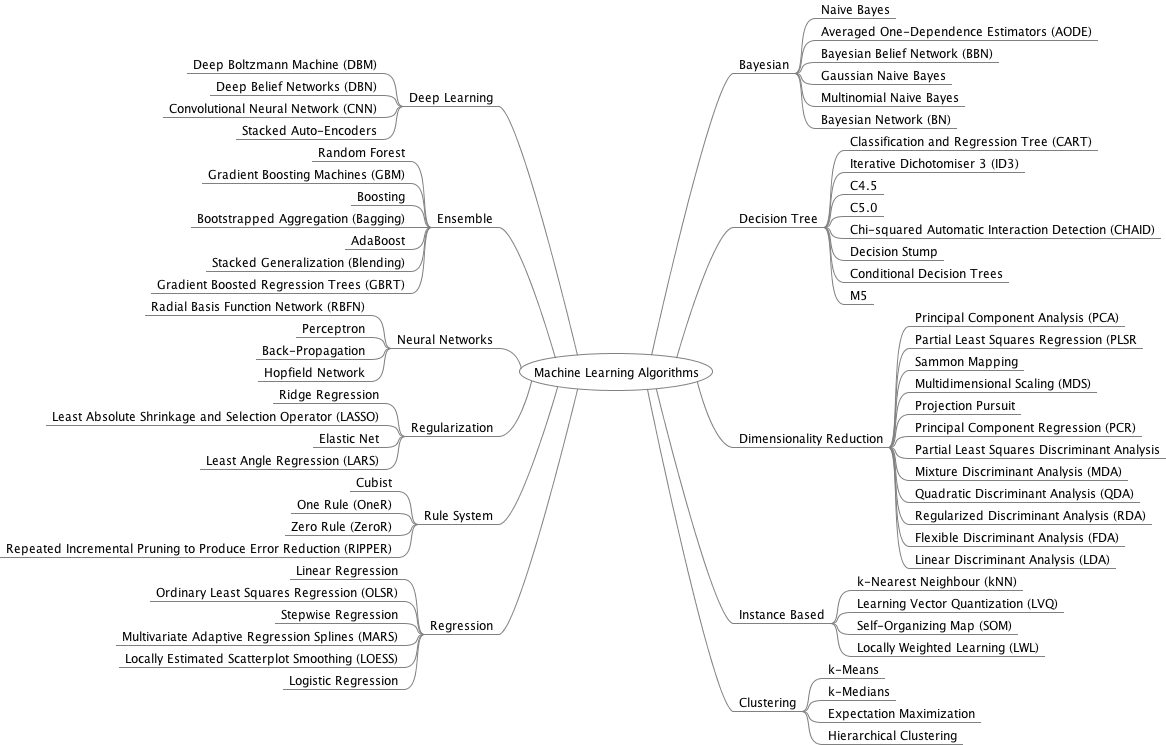
Clustering means "finding groups" in the data. This is analogous to "segmenting" in marketing. So the clustering techniques from machine learning can be used for segmentation.
Does it mean that the other methods shown on the chart above are useless for segmentation?
→ NO
For example, Principal Component Analysis (PCA) is classified in the chart as a technique for "dimensionality reduction" (we’ll explain this term in an other course), even if it has been used for a long time in marketing (and elsewhere) to segment a dataset (see a great example and tutorial here).
c. Two classic clustering methods: k-means and hierarchical clustering
Important | just to remind you that the goal of this course is to make you familiar and knowledgeable about what it means to do data science in a business context, not to turn you in data scientists. Knowing the general principles of k-means and hierarchical clustering is useful if you want to work productively as a business person with data scientists. |
The general approach for clustering is:
Get data For example, data on car drivers from consumer panel providing info on their demographics, tastes in car size and design, and pricing preferences
Develop measures of association This means creating a measure of “which customer is similar to which” in terms of their features
For example, families with young children will be roughly similar in terms of demographics, needs and budget.
Deal with outliers Removing car drivers that have extreme values? (the one car driver that needs a race car, etc.)
Form segments Use analytical techniques to create groups of car drivers based on their associations. Also called “clusters” or “communities”.
Profile segments and interpret results Groups have now been found automatically. Identify what these groups mean and how they show a path for action.
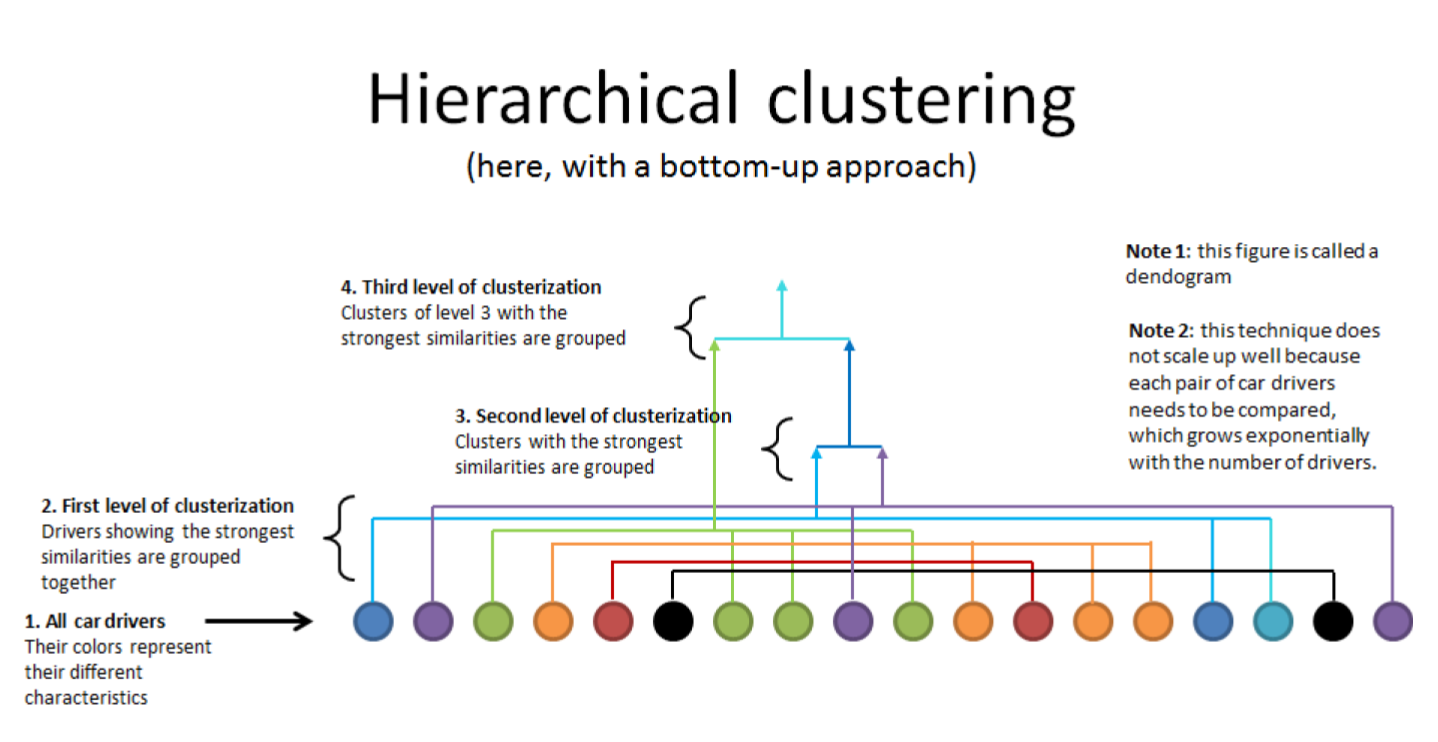
d. hierarchical clustering
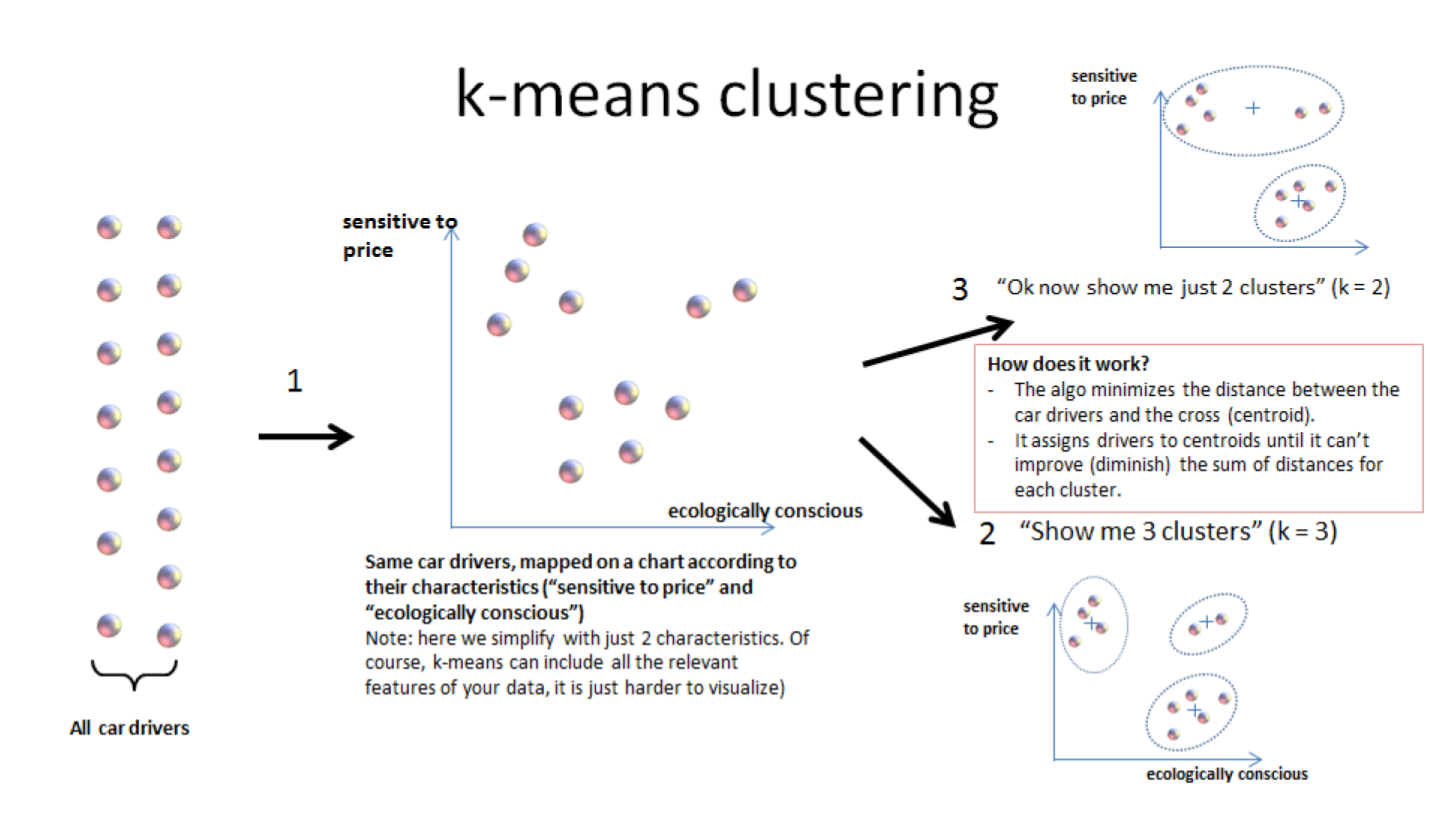
e. k-means clustering
f. clustering using community detection - via network analysis
This last example of a clustering technique is a bit fancy - not usually represented in ML cheatsheets.
See the lesson on "Network analysis and text mining" for an example of how it can be practised in Gephi.
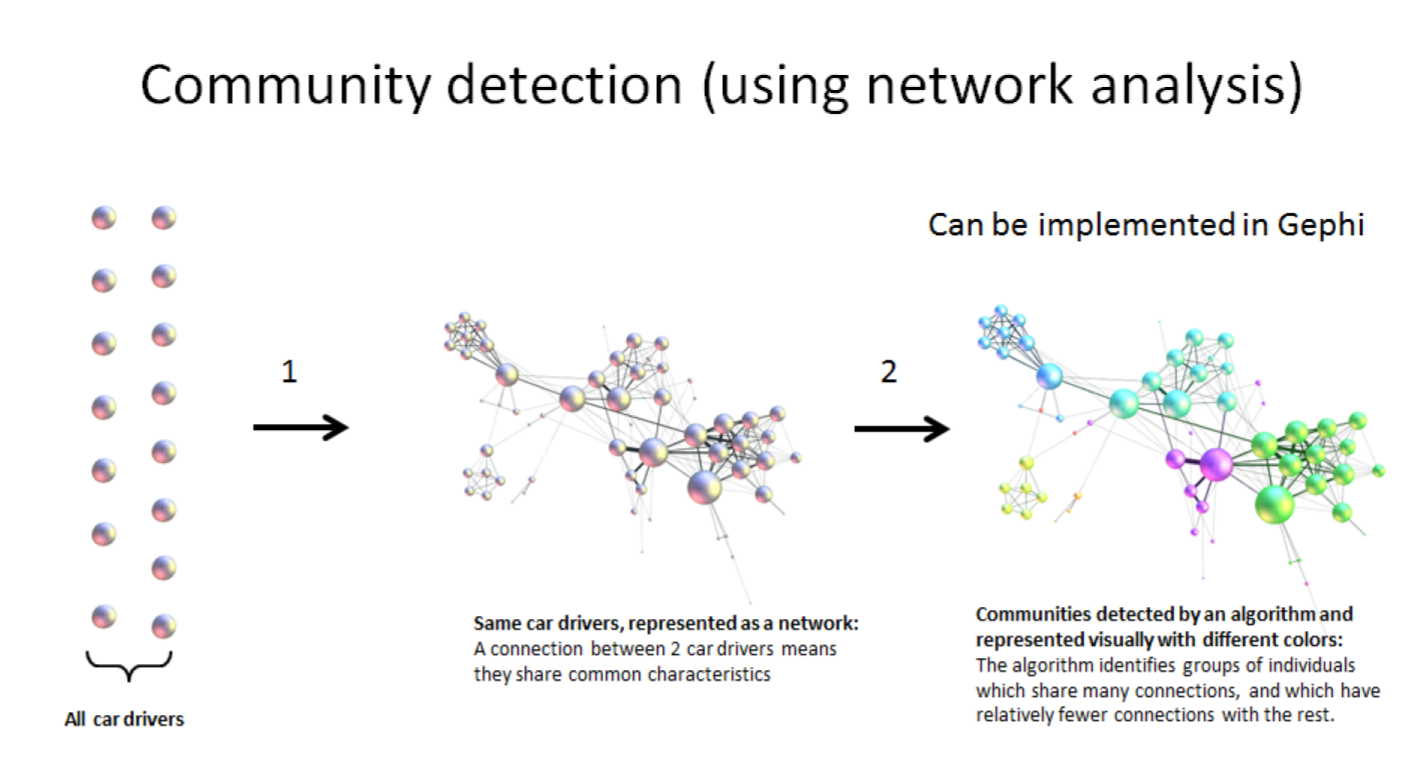
This clustering example is particularly interesting because the number of clusters found in the dataset is not specified in advance: it "emerges" through the analysis.
(contrary to k-means where the number of clusters is set by the analyst: it is the "k" parameter).
3. Last notes: clustering, useful beyond segmentation in marketing
→ It reveals groups, relations between groups
→ With the network approach, it can even point to the position of single individuals in each group (are they central? Do they bridge to other segments?)
→ Useful for operational marketing (ex: email campaigns), not just strategic product launch!
The end
Find references for this lesson, and other lessons, here.
 This course is made by Clement Levallois.
Discover my other courses in data / tech for business: https://www.clementlevallois.net
Or get in touch via Twitter: @seinecle