Defining big data
2017-31-07
last modified: 2023-05-15
== !
1. Big data is a mess
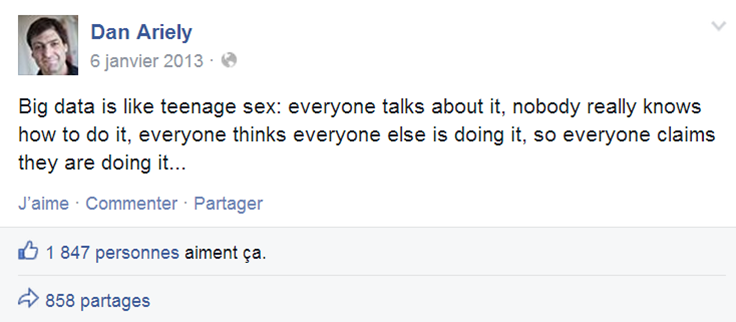
Jokes aside, defining big data and what it covers needs a bit of precision. Let’s bring in some clarity.
2. The 3 V
Big data is usually described with the 3 Vs, first proposed by Douglas Laney from Gartner in 2001:
V for Volume
The size of datasets available today is staggering (ex: Facebook had 250 billion pics in 2016). We produce a phenomenal amount of data in the course of our daily lives (to the point of sometimes missing an experience not mediated by technology - as this grandmother understood it)

The volumes of data are increasing at an accelerating rate. According to sources, 90% of all the data in the world has been generated over the last two years (statement from 2013) or said differently, more data will be created in 2017 than the previous 5,000 years of humanity.
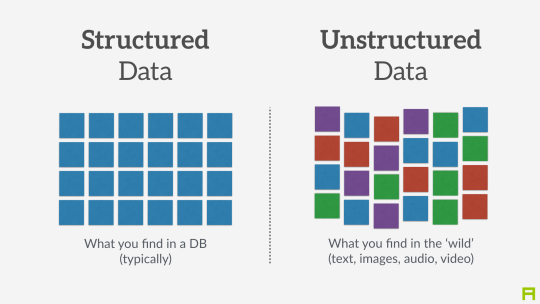
V for Variety
"Variety" refers to the fact that "unstructured" data is considered to be increasingly useful, when before the big data phenoenon only structured data was considered worth storing and exploiting. This calls to explain in more details the distinction between unstructured and structured data.
A - Structured data
Structured data refers to data which is formatted and organized according to a well defined set of rules, which makes it machine readable.
For example, zip codes are a structured dataset because they follow a precise convention regarding the number of letters and digits composing them, making it easy for an optical reader and software to identify and "read" them. Same with license plates, social security numbers… these are examples of structured data.
But these are simple examples. What about, for instance, a tax form?
If each field of the form is well defined, then the data collected through the form can be said to be "structured".
By contrast, a form where the user can write free text (think of a comment on a blog post, or a blank space where users can write a feedback) produces unstructured data: data which does not follow a special convention for its size and content. This is typically much harder for software to process, hence to analyze.
To summarize, think of structured data as as anything that can be represented as well organized tables of numbers and short pieces of text with the expected format, size, and conventions of writing: phonebooks, accounting books, governmental statistics…

B - Unstructured data
Unstructured data refers to datasets made of "unruly" items: text of any length, without proper categorization, encoded in different formats, including possibly pictures, sound, geographical coordinates and what not…
These datasets are much harder to process and analyze, since they are full of exceptions and differences. But they are carry typically rich information: free text, information recorded "in the wild"…
V for Velocity
In a nutshell, the speed of creation and communication of data is accelerating:
Facebook hosts 250 billion pics? It receives 900 million more pictures per day
Examining tweets can be done automatically (with computers). If you want to connect to Twitter to receive tweets in real time as they are tweeted, be prepared to receive in excess of 500 million tweets per day. Twitter calls this service the "Twitter firehose", which reflects the velocity of the stream of tweets.

Sensor data is bound to increase speed as well. While pictures, tweets, individual records… are single item data sent at intervals, more and more sensors can send data in a continuous stream (measures of movement, sound, etc.)
So, velocity poses challenges of its own: while a system can handle (store, analyze) say 100Gb of data in a given time (day or month), it might not be able to do it in say, a single second. Big data refers to the problems and solutions raised by the velocity of data.
A 4th V can be added, for Veracity or Value
Veracity relates to trustworthiness and compliance: is the data authentic? Has it been corrupted at any step of its processing? Does it comply with local and international regulations?
3. What is the minimum size to count as "big data"? It’s all relative
There is no "threshold" or "minimum size" of a dataset where "data" would turn from "small data" to "big data". It is more of a relative notion: it is big data if current IT systems struggle to cope with the datasets. "Big data" is a relative notion… how so?
a. relative to time
what was considered "big data" in the early 2000s would be considered "small data" today, because we have better storage and computing power today.
this is a never ending race: as IT systems improve to deal with "current big data", data gets generated in still larger volumes, which calls for new progress / innovations to handle it.
b. relative to the industry
what is considered "big data" by non tech SMEs (small and medium-sized enterprises) can be considered trivial to handle by tech companies.
c. not just about size
the difficulty for an IT system to cope with a dataset can be related to the size (try analyzing 2 Tb of data on your laptop…), but also related to the content of the data.
For example the analysis of customer reviews in dozens of languages is harder than the analysis of the same number of reviews in just one language.
So the general rule is: the less the data is structured, the harder it is to use it, even if it’s small in size (this relates to the "V" of variety seen above).
d. no correlation between size and value
"Big data is often called the new oil", as if it would flow like oil and would power engines "on demand".
Actually, big data is created: it needs work, conception and design choices to even exist (what do I collect? how do I store it? what structure do I give to it?). The human intervention in creating data determines largely whether data will be of value later.
Example: Imagine customers can write online reviews of your products. These reviews are data. But if you store these reviews without an indication of who has authored the review (maybe because reviews can be posted without login oneself), then the reviews become much less valuable.
Simple design decisions about how the data is collected, stored and structured have a huge impact on the value of the data.
So, in reaction to large, unstructured and badly curated datasets with low value at the end, a notion of "smart data" is sometimes put forward: data which can be small in size but which is well curated and annotated, enhancing its value (see also here).
4. Where did big data come from?
a. The digitalization of the economy generated new volumes of data
b. Computers became more powerful

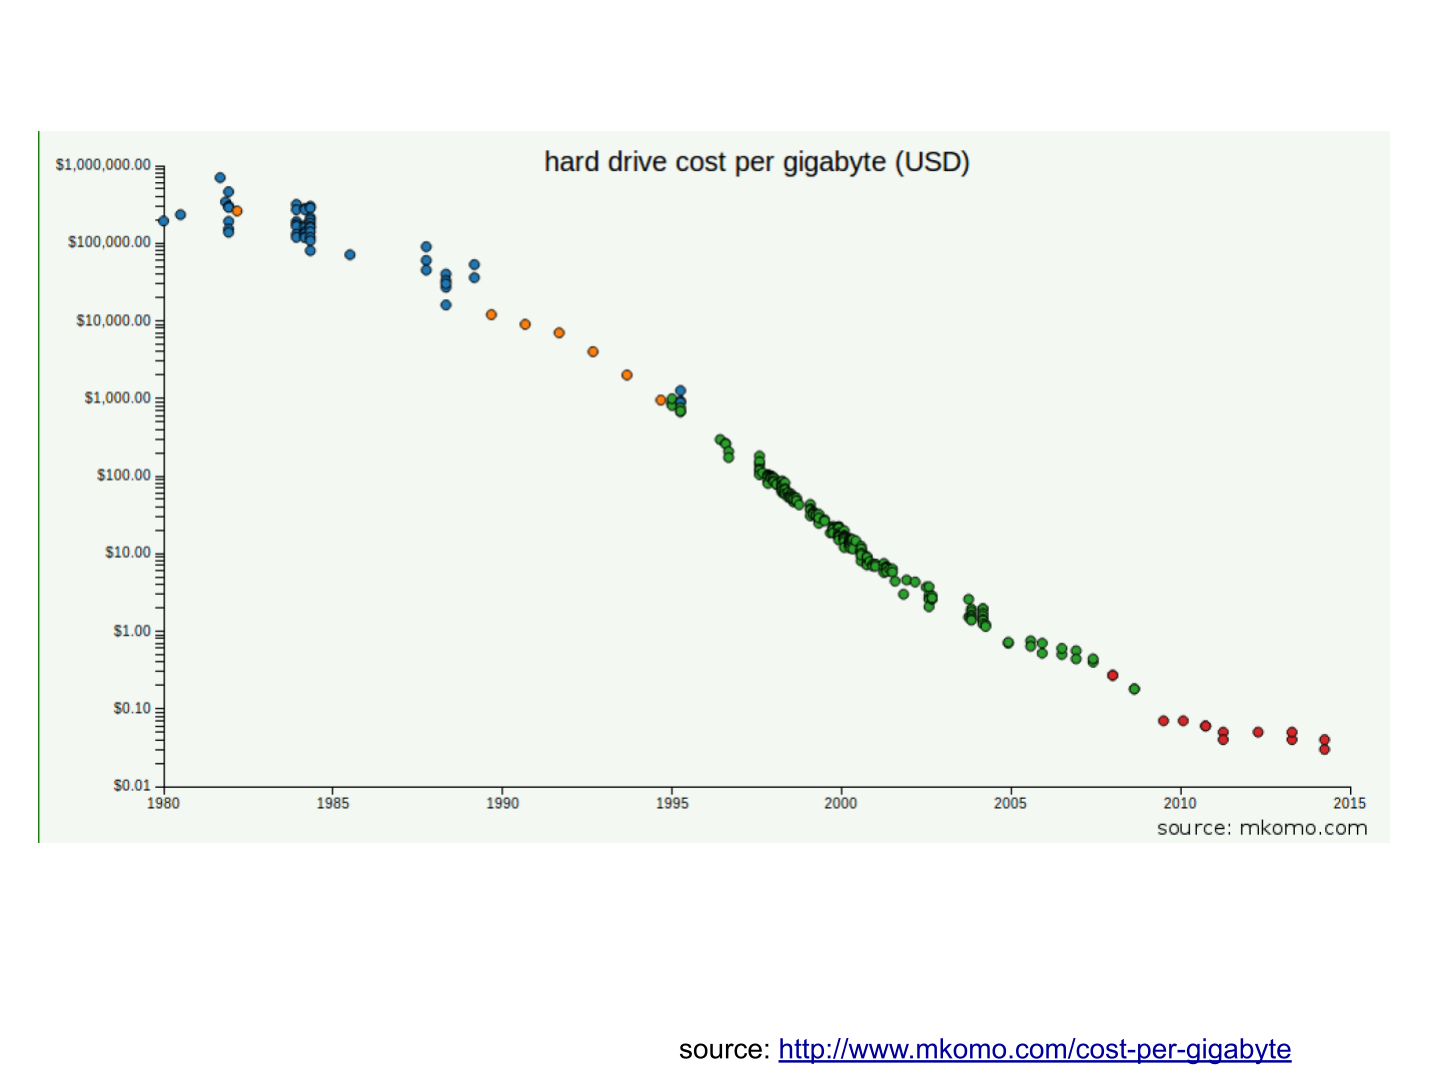
c. Storing data became cheaper every year
d. The mindset changed as to what "counts" as data
Unstructured data (see above for definition of "unstructured") was usually not stored: it takes a lot space, and software to query it was not sufficiently developed.
Network data (also known as graphs) (who is friend with whom, who likes the same things as whom, etc.) was usually neglected as "not true observation", and hard to query. Social networks like Facebook made a lot to make businesses aware of the value of graphs (especially social graphs). Neo4J or Titan are database providers specialized in network data storage and analysis.
e. Open source software accelerated innovation
In the late 1990s, a rapid shift in the habits of software developers kicked in: they tended to use more and more open source software, and to release their software as open source. Until then, most of the software was "closed source": you buy a software without the possibility to reuse / modify / augment its source code. Just use it as is.
Open source software made it easy to get access to software built by others and use it to develop new things. After several decades, open source software have become common place.
f. Hype kicked in
The Gartner hype cycle is a tool measuring the maturity of a technology, differentiating expectations from actual returns:
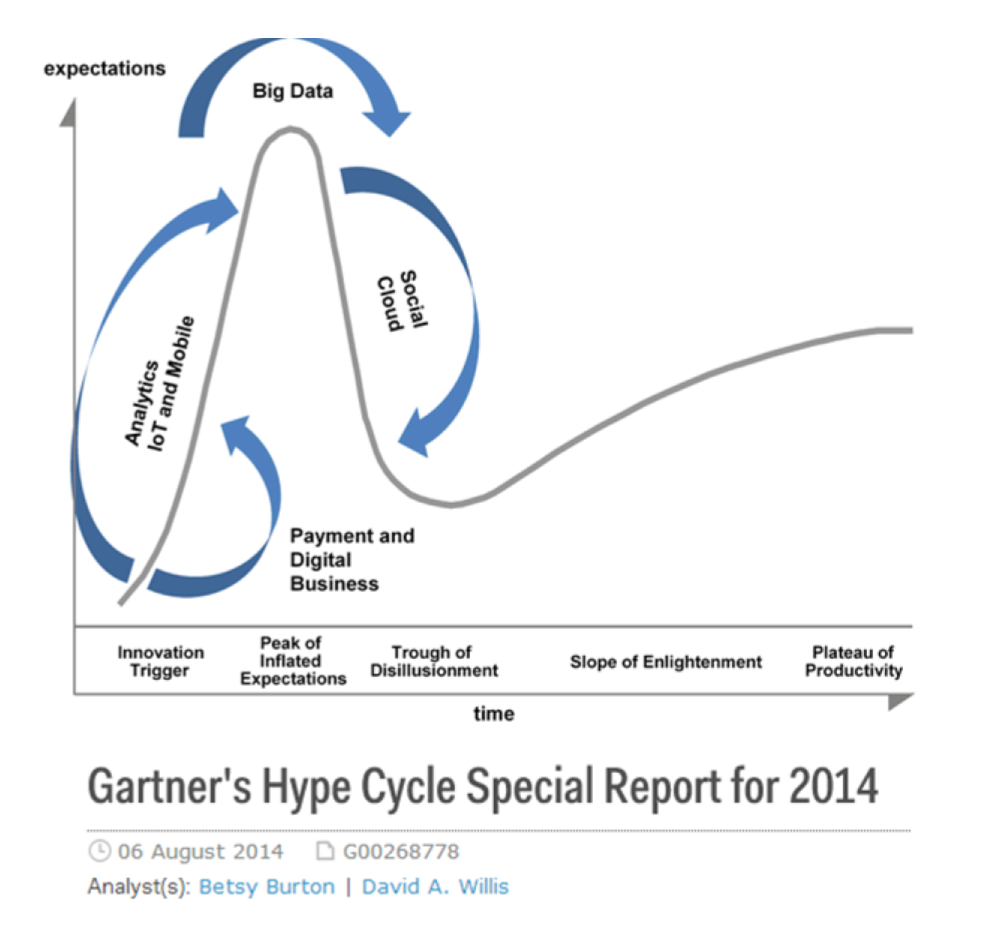
This graph shows the pattern that all technologies follow along their lifetime:
at the beginning (left of the graph), an invention or discovery is made in a research lab, somewhere. Some news reporting is done about it, but with not much noise.
then, the technology starts picking the interest of journalists, consultant, professors, industries… expectations grow about the possibilities and promises of the tech. "With it we will be able to [insert amazing thing here]"
the top of the bump is the "peak of inflated expectations". All technics and innovation tend to be hyped and even over hyped. This means the tech is expected to deliver more than it surely will, in actuality. People get overdrawn.
then follows the "Trough of Disillusionment". Doubt sets in. People realize the tech is not as powerful, easy, cheap or quick to implement as it first seemed. Newspapers start reporting depressing news about the tech, some bad buzz spreads.
finally: slope of Enlightenment. Heads get colder, expectations get in line with what the tech can actually deliver. Markets stabilize and consolidate: some firms close and key actors continue to grow.
then: plateau of productivity. The tech is now mainstream.
Note | All technology can "die" - fall into disuse - before reaching the right side of the graph of course |
In 2014, big data was near the top of the curve: it was getting a lot of attention but its practical use in 5 to 10 years were still uncertain. There were "great expectations" about its future, and these expectations drive investment, research and business in big data.
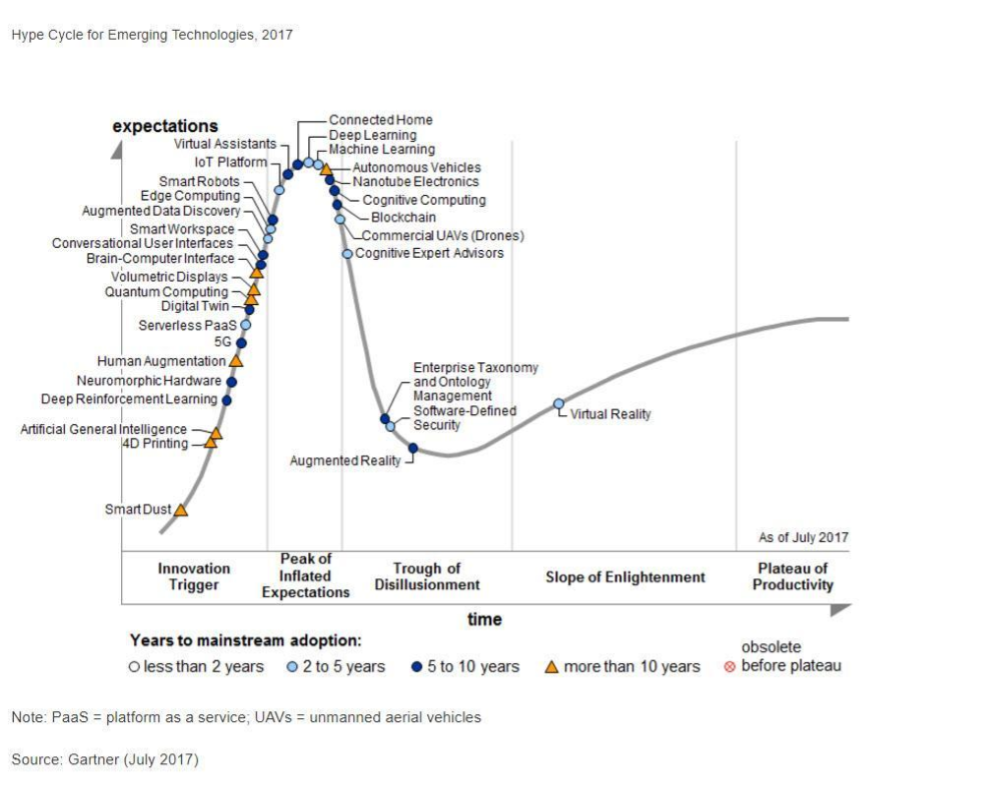
In 2017, "big data" is still on top of hyped technologies, but is broken down in "deep learning" and "machine learning". Note also the "Artificial General Intelligence" category:
g. Big data transforms industries, and has become an industry in itself
Firms active in "Big data" divide in many sub-domains: the industry to manage the IT infrastructure for big data, the consulting firms, software providers, industry-specific applications, etc…
Matt Turck, VC at FirstMarkCap, creates every year a sheet to visualize the main firms active in these subdomains. This is the 2017 version:
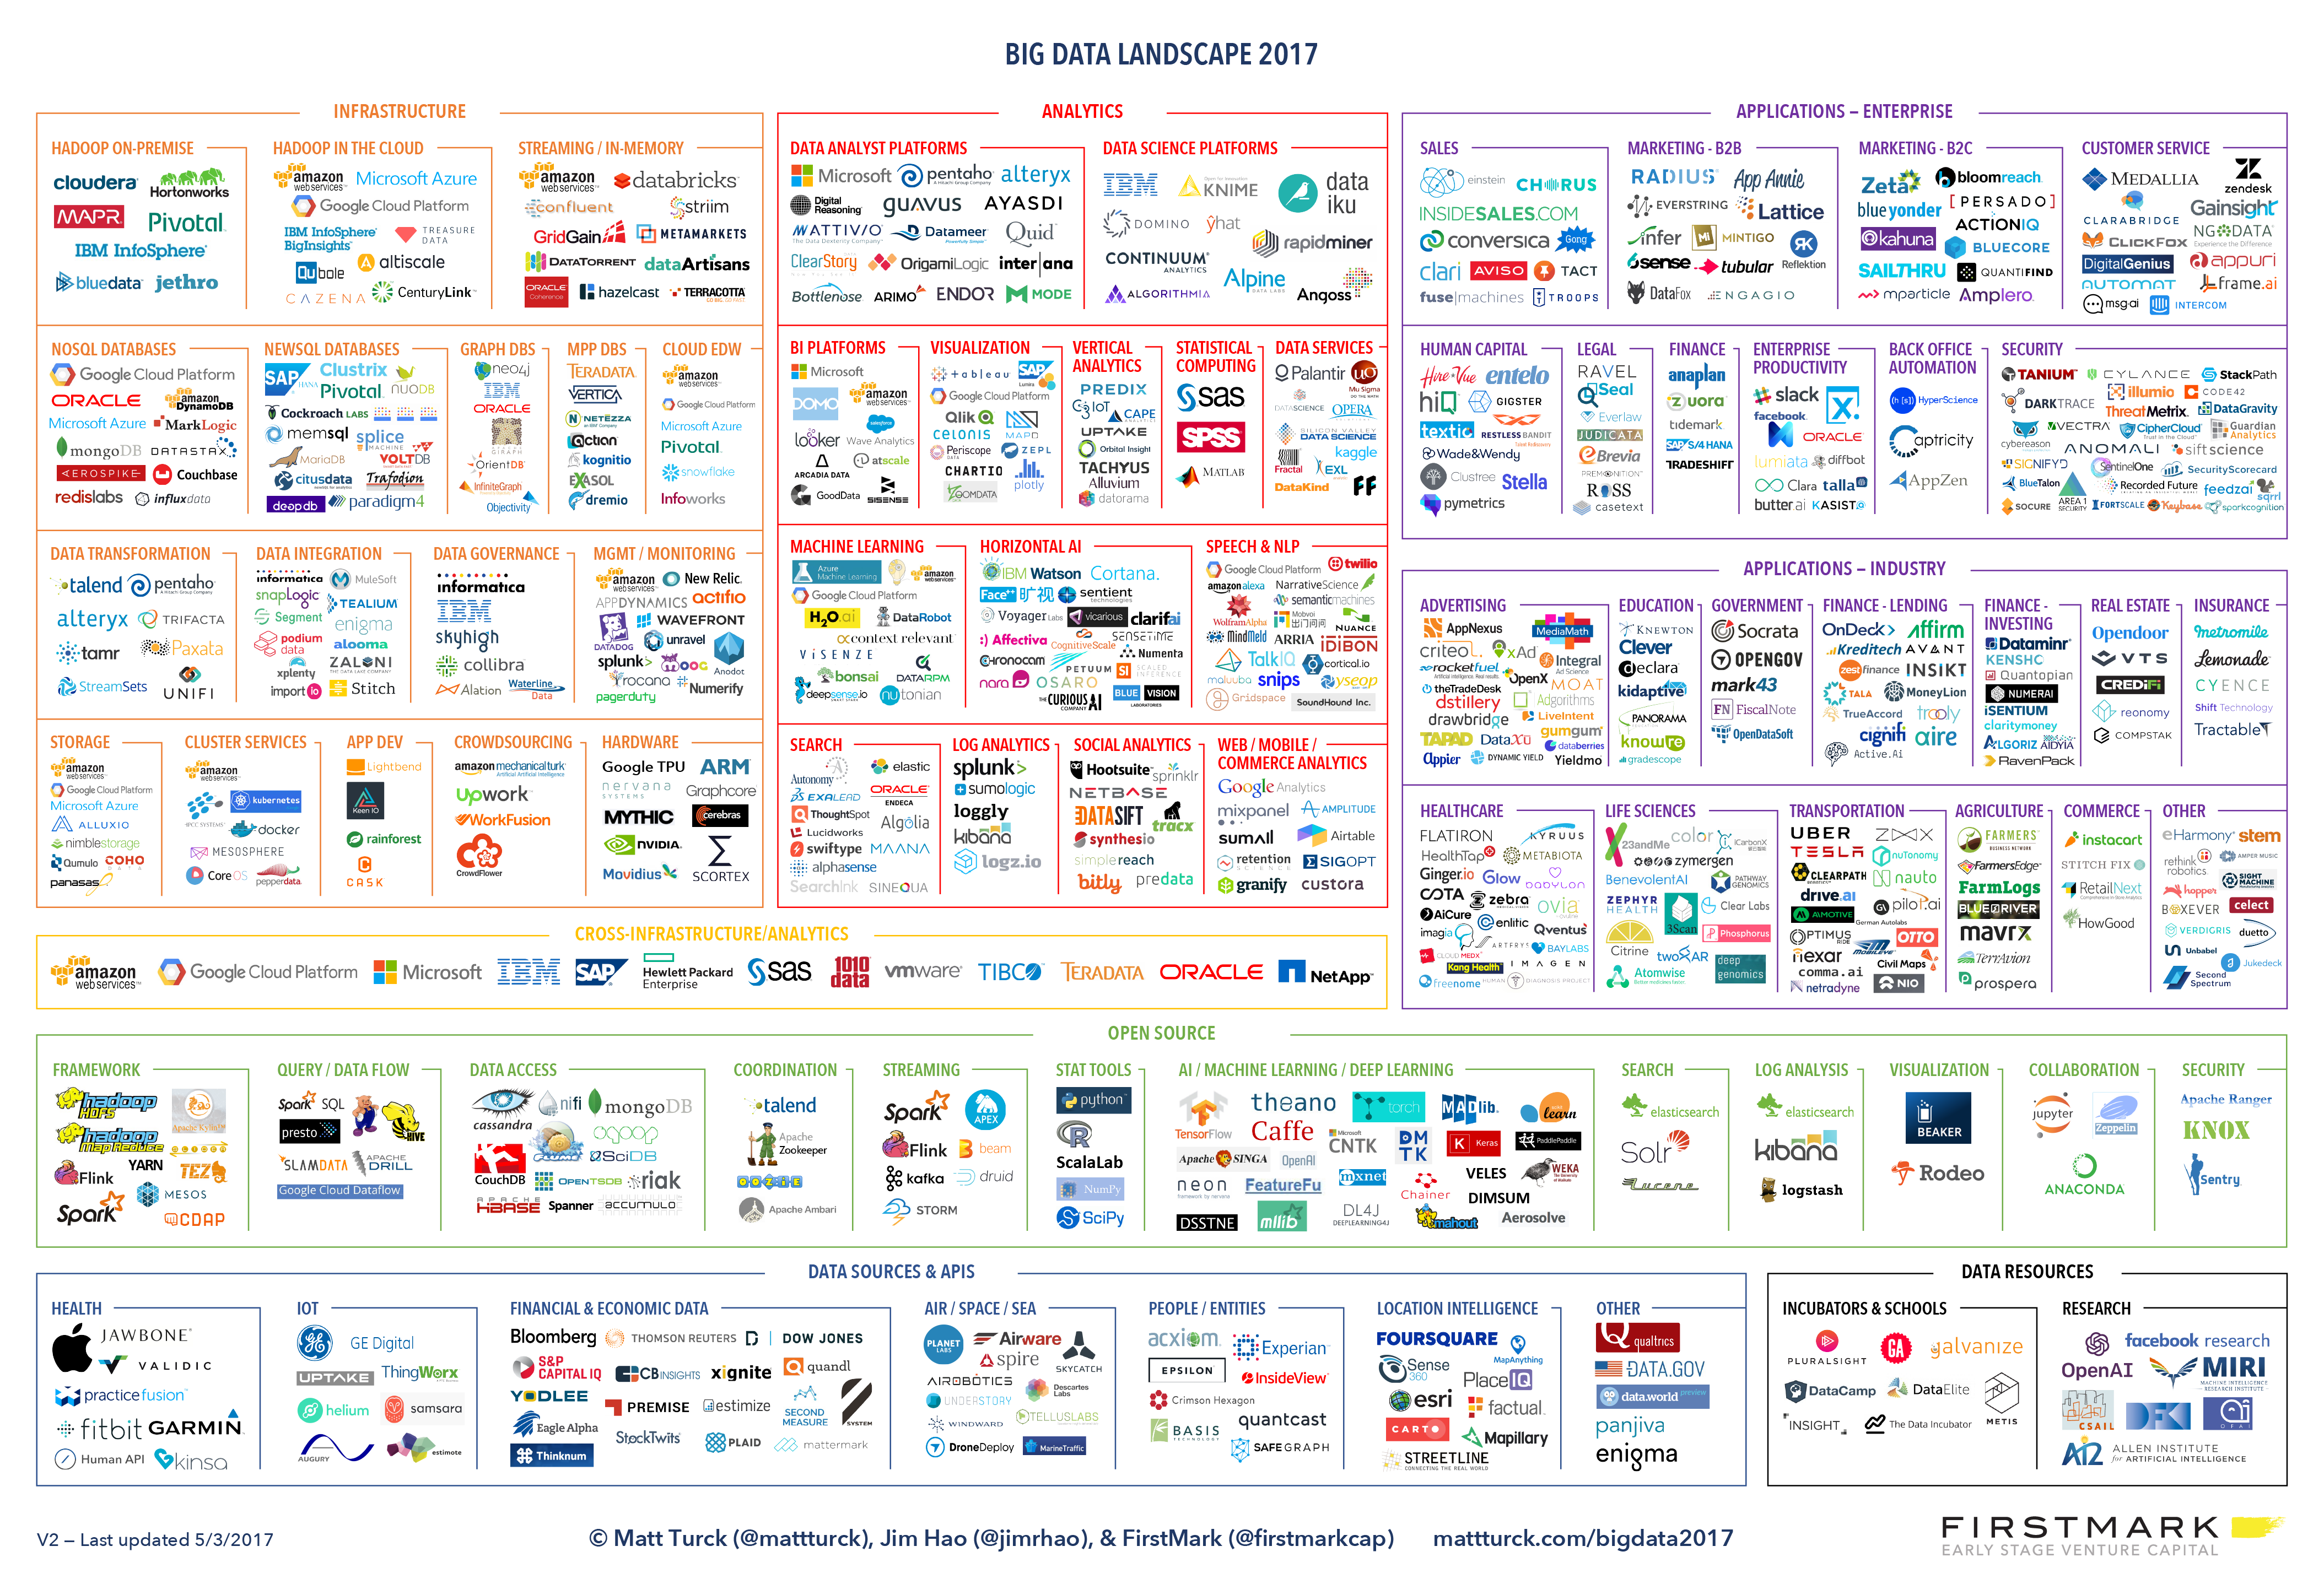
You can find a high res version of the Big data panorama, an Excel sheet version, and a very interesting comment on this website: https://mattturck.com/bigdata2017/
5. What is the future of big data?
a. More data is coming
The Internet of things designates the extension of Internet to objects beyond web pages or emails.
The IoT is used to do things (display information on screen, pilote robots, etc.) but also very much to collect data in their environments, through sensors.
Hence, the development of connected objects will lead to a tremendous increase in the volume of data collected.
b. "big data" gains new importance with artificial intelligence
Artificial intelligence (AI) enables a computer to achieve results similar or better than what humans can do: play chess, guess which objects are visible on a picture, drive a vehicule, …
While there are several families of AI, the predominant technique for AI needs large volumes of data to perform well. For example, an AI which can "guess" which objects are visible on a picture needs to be "trained" on millions of pictures to get good results.
This is where big data and AI bridge: "big data" is the fuel that enables AI to work. All industries today develop products and services based on AI. As a result, these industries increase their effort in big data: collecting, storin and analyzing greater volumes and a variety of data.
c. Regulatory frameworks will grow in complexity
Societal impacts of big data and AI are not trivial, ranging from racial, financial and medical discrimination to giant data leaks, or economic (un)stability in the age of robots and AI in the workplace.
Public regulations at the national and international levels are trying to catch up with these challenges. As technology evolves quickly, we can anticipate that societal impacts of big data will take center stage.
GDPR, a regulation passed by the European Union in 2019 protecting the personal data of citizens, is directly addressing the new concerns for privacy raised by big data.
The end
Find references for this lesson, and other lessons, here.

This course is made by Clement Levallois.
Discover my other courses in data / tech for business: https://www.clementlevallois.net
Or get in touch via Twitter: @seinecle